 ar
ar bg
bg hr
hr cs
cs da
da nl
nl fi
fi fr
fr de
de el
el hi
hi it
it ko
ko no
no pl
pl pt
pt ro
ro ru
ru es
es sv
sv tl
tl iw
iw id
id lv
lv lt
lt sr
sr sk
sk sl
sl uk
uk vi
vi et
et hu
hu th
th tr
tr fa
fa ms
ms hy
hy ka
ka ur
ur bn
bn mn
mn ta
ta kk
kk uz
uz ku
ku
wind speed and direct sensor
A handover-ready Kingmach wind speed and direct sensor record should explain how environmental conditions were measured and why each point exists. It should include point location, measured condition, installation photo, cable route, power source, data channel, unit, first stable reading, maintenance access, and linked structural records. This matters because environmental stations often remain useful after the construction team leaves. A later owner may need to understand whether a slope moved after rainfall, whether a bridge vibrated during wind, or whether a cabinet failed after humidity rose. Without a clear handover record, those questions become guesswork. With one, the environmental record becomes part of long-term asset management, supporting maintenance budgets, inspection planning, and abnormal-event review.
For field teams, this point is most useful when the record shows the condition before the structural response, during the response, and after the site returns to routine operation. The note should include weather timing, inspection access, nearby construction, and whether the linked structural points changed in the same period.
A good review habit is to compare the condition channel with the nearest asset behavior instead of reading it as a standalone weather value. That keeps the record tied to slope movement, bridge response, tunnel equipment, dam seepage, drainage behavior, or cabinet reliability.
The installation file should explain why the location represents the monitored area. If the point is sheltered, shaded, exposed, buried, elevated, or placed inside an enclosure, that fact changes how later readings should be understood by maintenance staff.


Application of wind speed and direct sensor
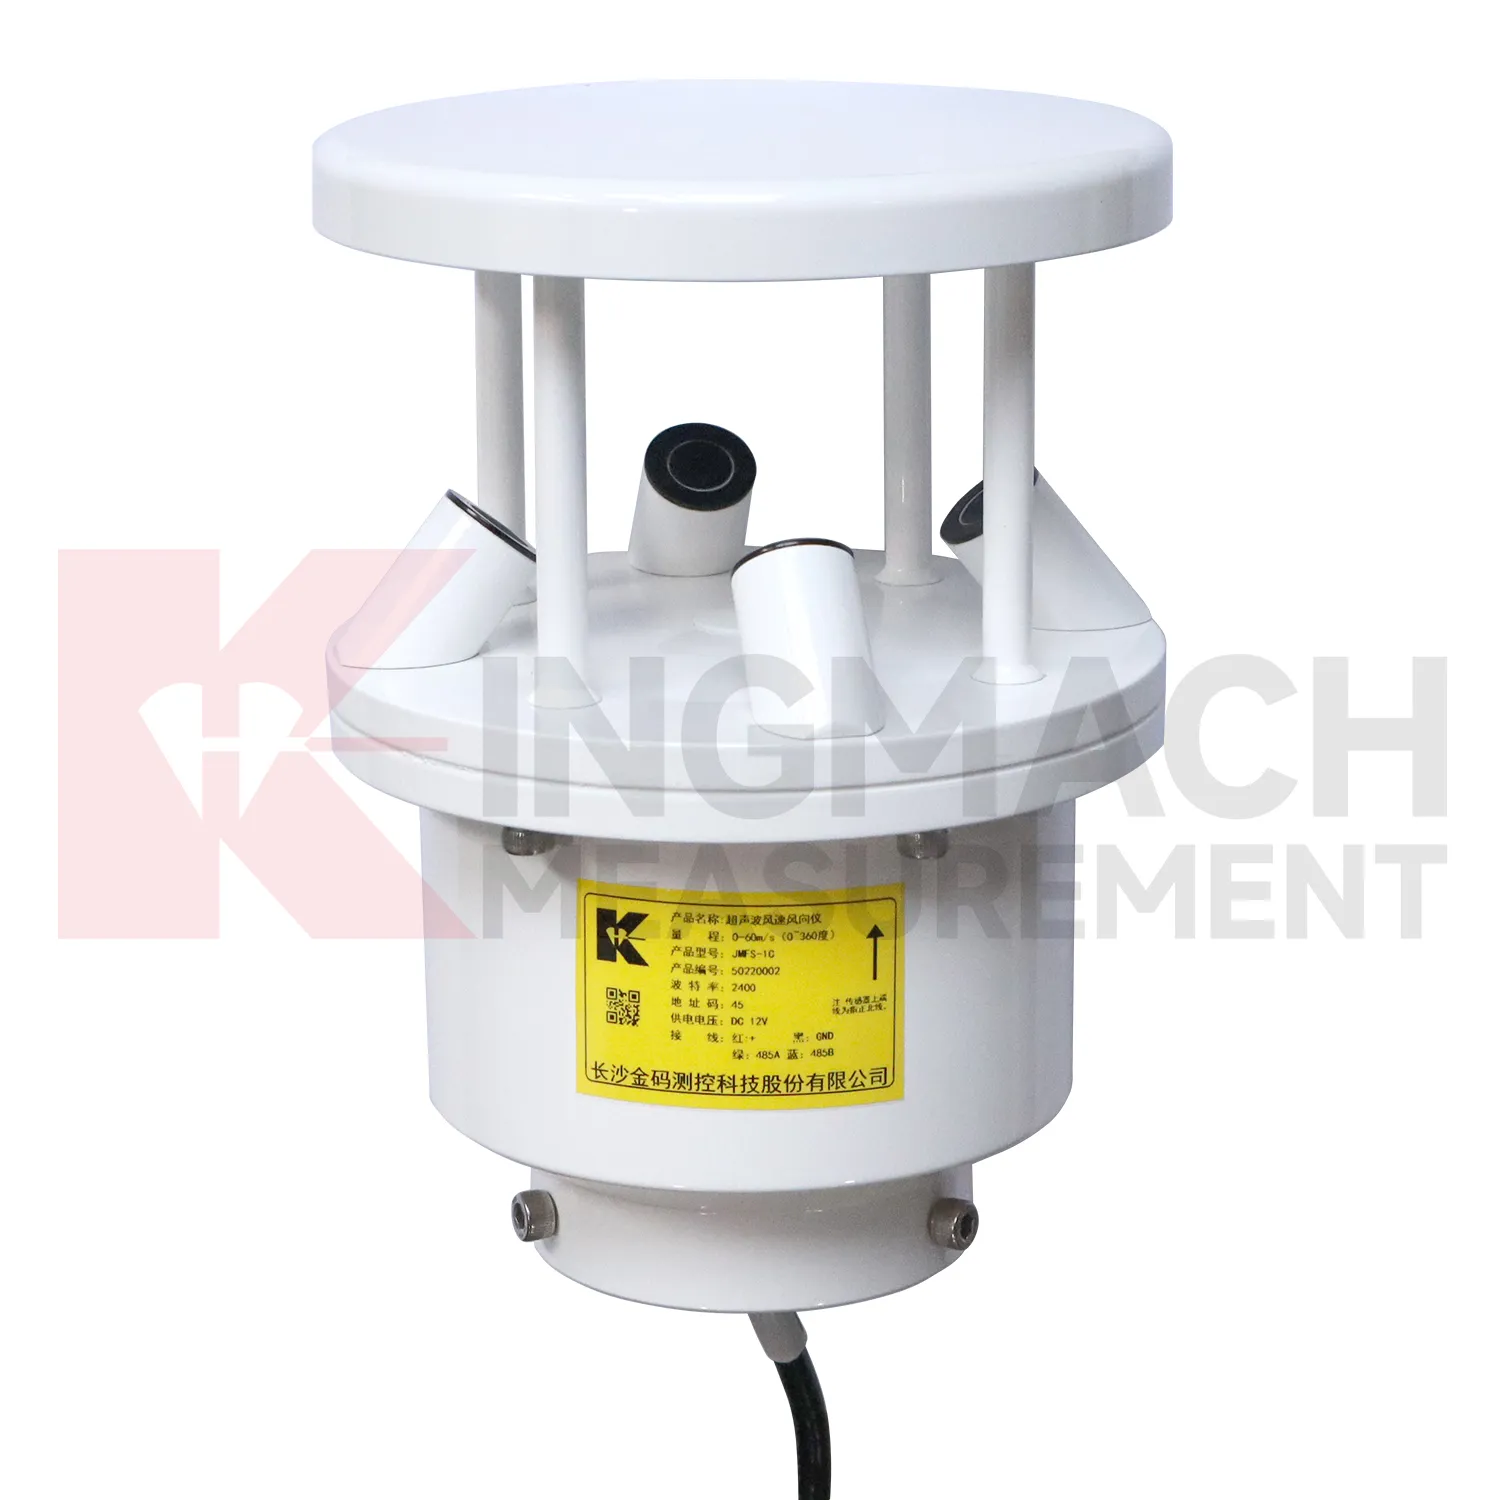
Urban environmental stations use Kingmach wind speed and direct sensor to support infrastructure management across bridges, tunnels, public buildings, drainage areas, transport corridors, and exposed equipment sites. A station may record rain, wind, air temperature, humidity, pressure, or soil wetness depending on the risk being managed. The most important design rule is representativeness. A rain point blocked by a roof edge, a wind point sheltered by a wall, or a humidity point hidden in an unrelated cabinet can mislead users. Public infrastructure data may be reviewed by many teams, so units, point names, installation photos, and maintenance notes must be clear. A well-run station helps connect environmental change to inspections, drainage response, traffic planning, and structural monitoring.
Long-term value comes from consistency. A channel that keeps the same location, unit, maintenance history, and linked asset record can support seasonal comparison, post-storm review, and handover between construction and operation teams.
Maintenance teams should record cleaning, access difficulty, enclosure condition, cable repair, vegetation growth, nearby equipment changes, and the first normal reading after work. Those notes protect the meaning of the curve when old data is reviewed months later.
The environmental point should be part of a named monitoring question. It may explain wetting, drying, wind exposure, thermal movement, cabinet stress, or pressure variation, but that purpose needs to be visible in drawings and reports.
The future of wind speed and direct sensor
Future Kingmach wind speed and direct sensor reporting will make abnormal-event review more traceable. A report that says a slope moved after rain should show rainfall timing, wetting response, movement rate, and inspection results together. A report that says bridge vibration rose during wind should show wind direction, wind period, structural response, and related maintenance notes. This reduces manual work and makes reports easier to defend. Environmental records should follow the same naming and time standards as structural records. When the reporting workflow is consistent, owners can compare events across seasons, assets, and maintenance teams.
The next step is report structure that follows the event, not the instrument list. A storm report should gather rain, wetting, seepage, ground movement, photographs, and field actions. A heat-related report should gather temperature, strain behavior, expansion observations, and cabinet status. This makes the document easier for owners, designers, and field crews to review together.
Traceable reporting also protects future decisions. If the same asset produces another alarm years later, the team can compare event type, measured condition, inspection result, and repair action without rebuilding the story from scattered files. That continuity is often more useful than a single high-resolution curve.
Care & Maintenance of wind speed and direct sensor
Wind-station maintenance for Kingmach wind speed and direct sensor should preserve exposure and mounting stability. Check for new obstructions, loose poles, tilted brackets, damaged connectors, lightning effects, corrosion, ice, salt, dust, and cable strain. The wind point should represent the monitored bridge, tower, airport area, marine site, tunnel portal, or construction zone. If a nearby structure, scaffold, crane, or temporary cover changes airflow, the record may no longer explain the asset. Maintenance notes should state what was inspected, what was cleaned, and whether the first readings after work looked normal. Reliable wind data depends on both instrument condition and a clear flow path.
A good review habit is to compare the condition channel with the nearest asset behavior instead of reading it as a standalone weather value. That keeps the record tied to slope movement, bridge response, tunnel equipment, dam seepage, drainage behavior, or cabinet reliability.
The installation file should explain why the location represents the monitored area. If the point is sheltered, shaded, exposed, buried, elevated, or placed inside an enclosure, that fact changes how later readings should be understood by maintenance staff.
Kingmach wind speed and direct sensor
The data chain behind Kingmach wind speed and direct sensor should be as clear as the sensors themselves. Environmental channels may use different signal types, units, update intervals, and power needs. If the channel names are weak, a report may confuse rainfall with another station, wind direction with wind speed, or room humidity with cabinet humidity. Each point should have a unit, location, data path, inspection interval, and linked structural record. This prevents environmental data from being collected but ignored. During an alarm, the team should be able to open one timeline and see the condition change, the structural response, and the maintenance note. That is where environmental monitoring becomes practical.
During abnormal events, the first question is not only whether the value crossed a limit. The reviewer should ask what changed around the site, whether the related structure reacted, and whether a field inspection confirmed the same pattern.
Long-term value comes from consistency. A channel that keeps the same location, unit, maintenance history, and linked asset record can support seasonal comparison, post-storm review, and handover between construction and operation teams.
FAQ
Q: Can environmental data support asset management?
A: Yes. Long-term records help owners compare weather, exposure, maintenance events, and structural response across seasons and assets.
Q: How does it help during alarms?
A: It lets reviewers check whether a structural alarm followed rain, wind, temperature change, humidity rise, or another site condition.
Q: What should dashboards show?
A: Dashboards should link environmental channels to the structural risks they explain, rather than displaying unrelated values together.
Q: Why avoid product-list writing?
A: Readers need to understand monitoring purpose and field value; long product lists make the page harder to use and less natural.
Q: What is the best review habit?
A: Review environmental data with time-aligned structural readings, inspection notes, maintenance records, and the site event that triggered concern.
If the reading seems unusual, the team should check the physical condition of the station before drawing conclusions about the asset. Blockage, poor exposure, loose wiring, water entry, and changed surroundings can all create misleading patterns.
Reviews
Andrew Lee
The visualization software is intuitive and powerful. It helps us analyze monitoring data efficiently.
Robert Taylor
The weir flow meter is well-built and delivers accurate measurements. Great value for water management applications.
Latest Inquiries
To protect the privacy of our buyers, only public service email domains like Gmail, Yahoo, and MSN will be displayed. Additionally, only a limited portion of the inquiry content will be shown.
Ava***@gmail.comAustralia
Hi, I am looking for reliable tiltmeters and accelerometers for structural health monitoring. Please...
Emma***@gmail.comCanada
Dear Sir/Madam, we are interested in displacement transducers and settlement sensors for a geotechni...
Related product categories
- Temperature Sensor
- Chain-type Temperature Sensor
- Temperature String
- Daisy-Chained Digital Thermometer
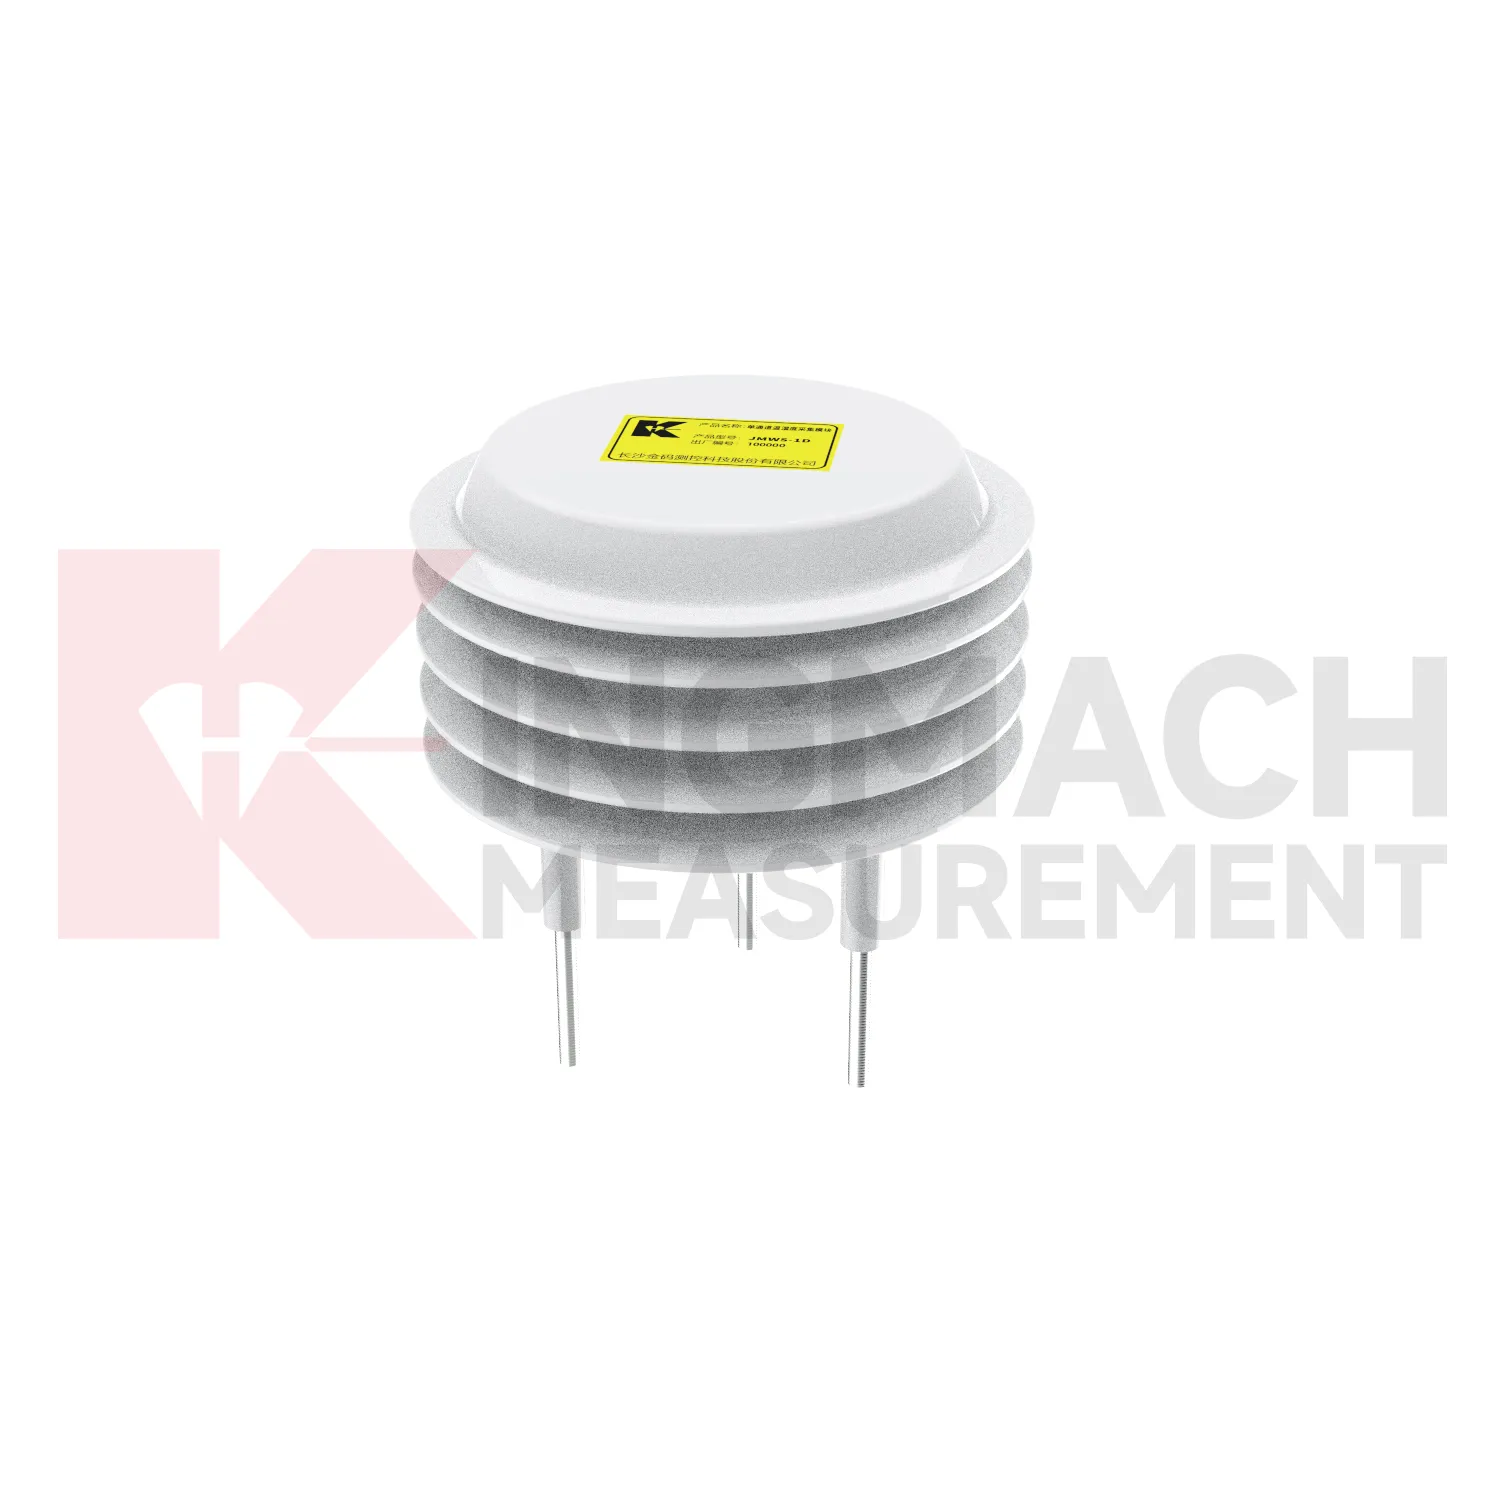
- Single-Channel Temperature and Humidity Acquisition Module
- Environmental Monitoring
- Integrated Monitoring Station
- Soil Water Content Sensor
- Ultrasonic Anemometer
- semiconductor temperature sensor
- semiconductor based temperature sensors
- semiconductor temperature sensors