 ar
ar bg
bg hr
hr cs
cs da
da nl
nl fi
fi fr
fr de
de el
el hi
hi it
it ko
ko no
no pl
pl pt
pt ro
ro ru
ru es
es sv
sv tl
tl iw
iw id
id lv
lv lt
lt sr
sr sk
sk sl
sl uk
uk vi
vi et
et hu
hu th
th tr
tr fa
fa ms
ms hy
hy ka
ka ur
ur bn
bn mn
mn ta
ta kk
kk uz
uz ku
ku
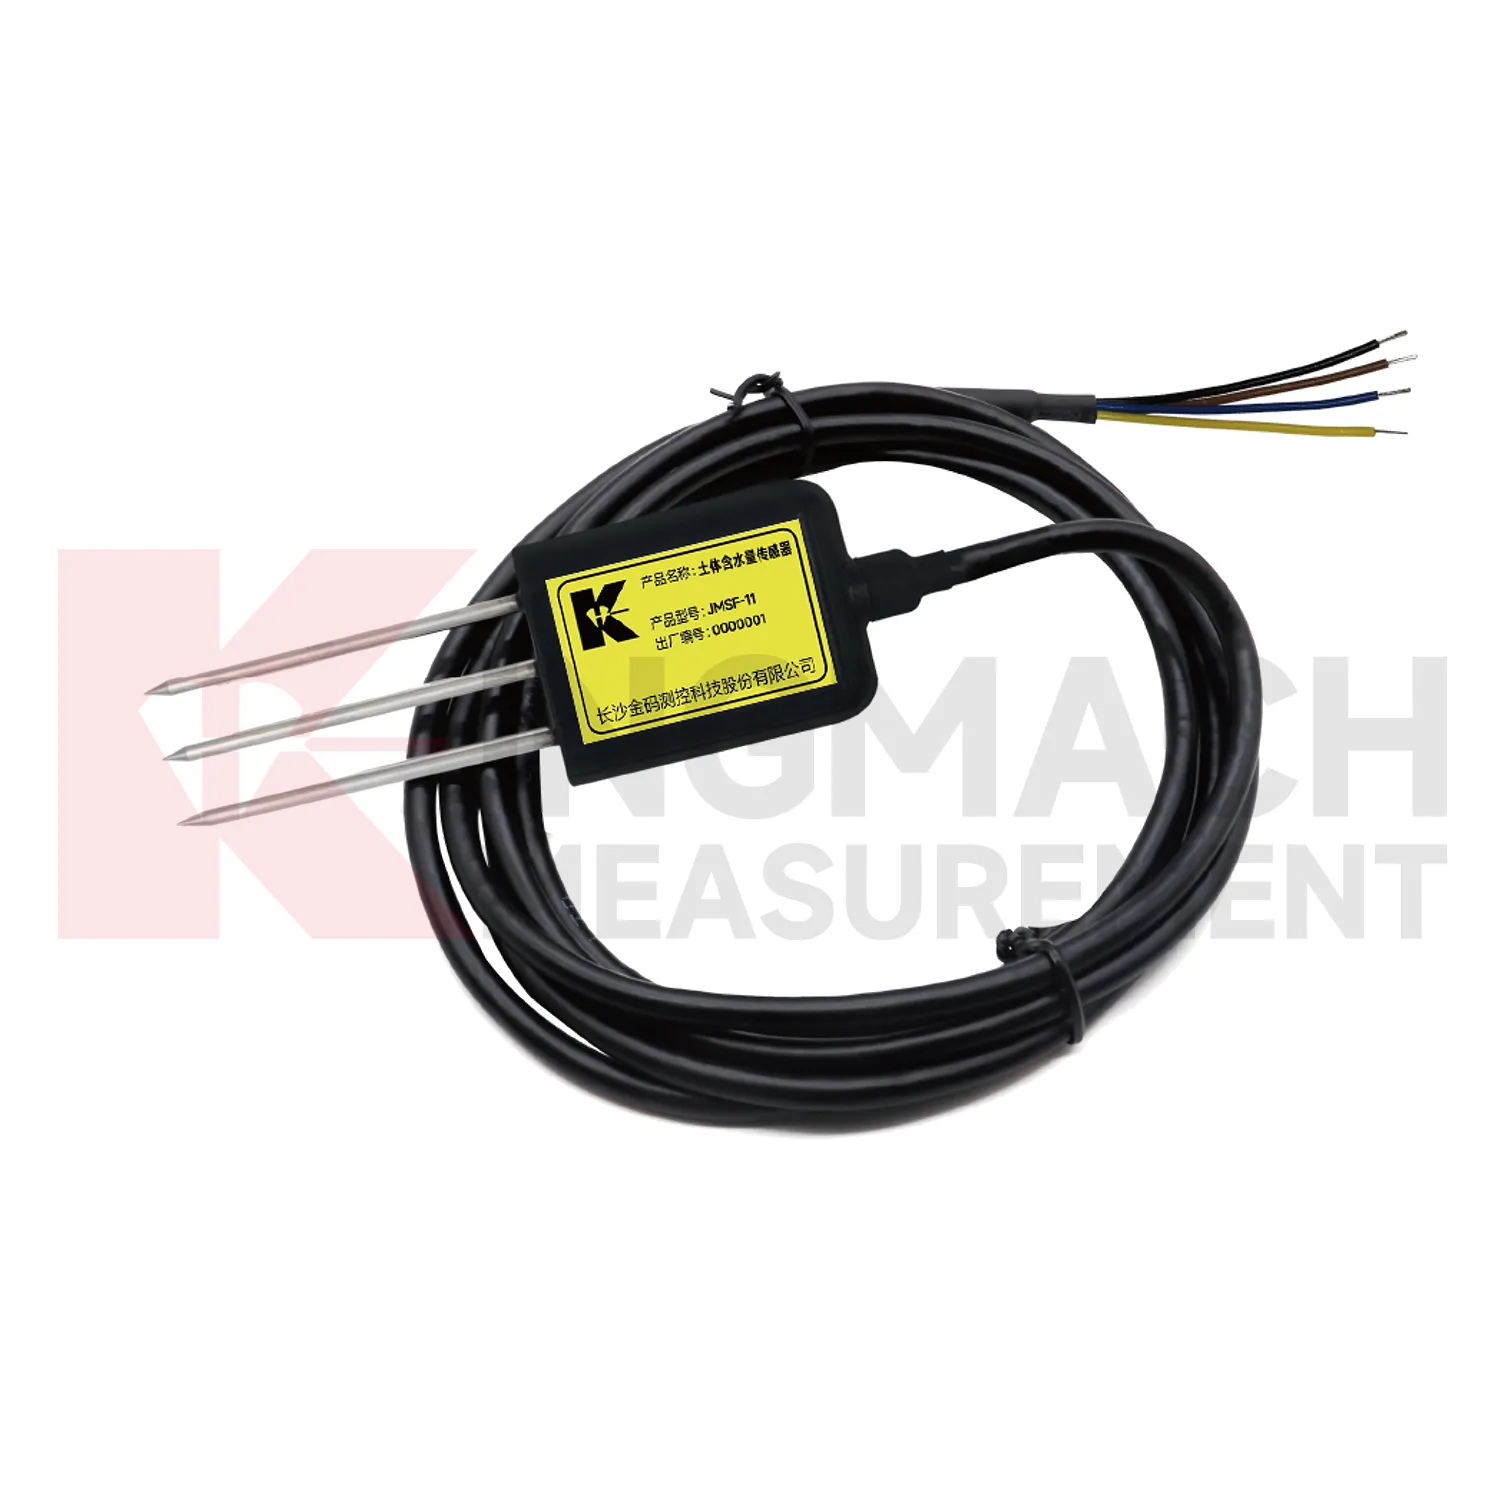
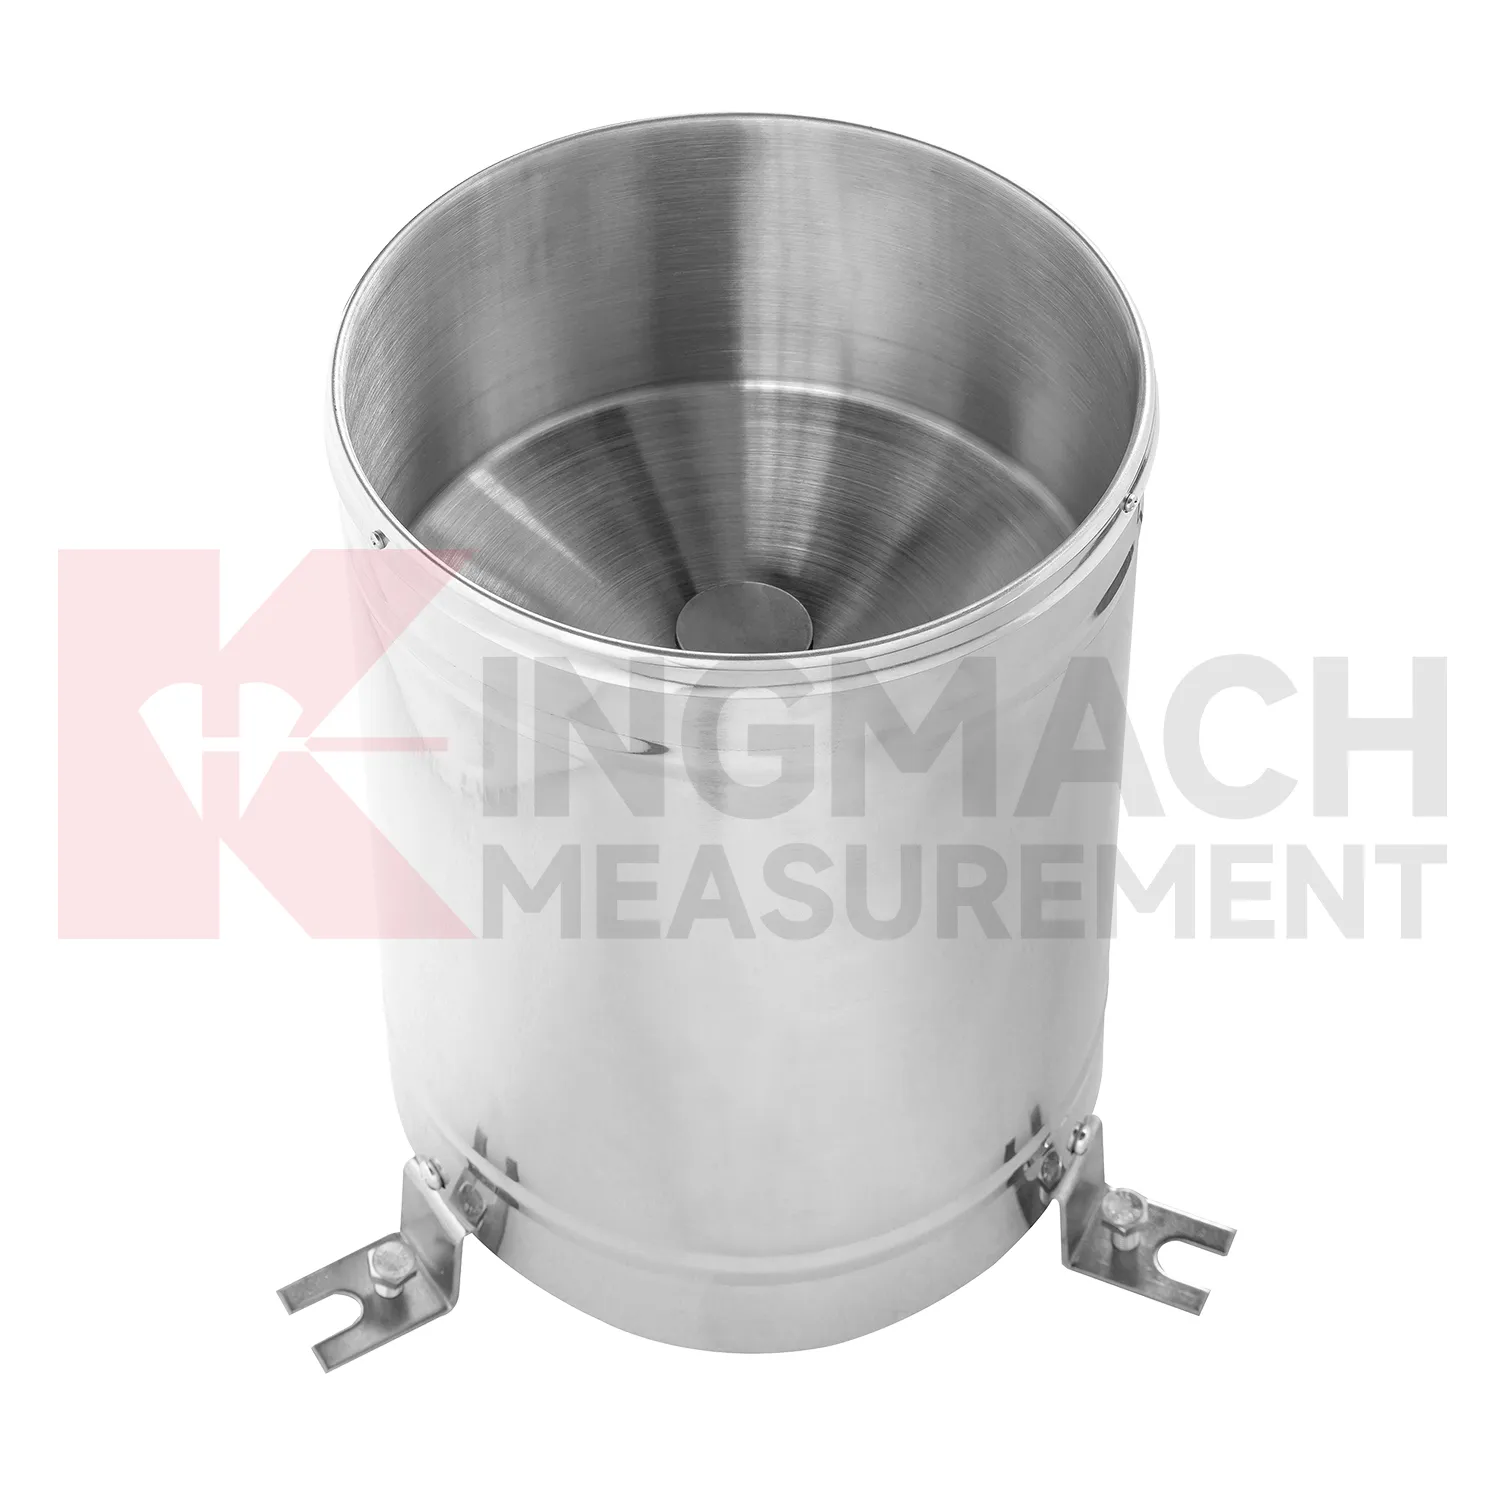
soil moisture temperature sensor
Data acquisition for Kingmach soil moisture temperature sensor should be organized around units, time, and relationships. Environmental channels may report rainfall, wind, pressure, temperature, humidity, or soil wetness, and each needs a clear unit and location. A mixed station becomes confusing if channel names are vague or if the data logger does not preserve the relation between environmental points and structural points. The project file should define which environmental channel supports which engineering review. Rainfall may connect to slope movement. Wind may connect to vibration. Temperature may connect to strain. Humidity may connect to cabinet maintenance. A simple channel map can save a great deal of time during an alarm. Good acquisition practice makes environmental data reliable enough to use when the site is under stress.
Long-term value comes from consistency. A channel that keeps the same location, unit, maintenance history, and linked asset record can support seasonal comparison, post-storm review, and handover between construction and operation teams.
Maintenance teams should record cleaning, access difficulty, enclosure condition, cable repair, vegetation growth, nearby equipment changes, and the first normal reading after work. Those notes protect the meaning of the curve when old data is reviewed months later.
The environmental point should be part of a named monitoring question. It may explain wetting, drying, wind exposure, thermal movement, cabinet stress, or pressure variation, but that purpose needs to be visible in drawings and reports.
Application of soil moisture temperature sensor
Geotechnical engineering uses Kingmach soil moisture temperature sensor to explain how water and weather affect ground behavior. Soil wetness, rainfall, temperature, and humidity can influence slopes, embankments, foundation pits, tunnel portals, retaining walls, and reclamation areas. Environmental data should be reviewed with inclinometers, settlement sensors, displacement meters, pore-pressure records, and field inspections. A deformation curve during dry weather may suggest a different cause than a curve following repeated rainfall and rising soil wetness. Engineers also need to know whether construction work, loading, drainage changes, or excavation occurred during the same period. Environmental monitoring gives the missing condition layer, helping the team move from “the ground moved” to a more useful question: what changed around the ground before it moved?
If the reading seems unusual, the team should check the physical condition of the station before drawing conclusions about the asset. Blockage, poor exposure, loose wiring, water entry, and changed surroundings can all create misleading patterns.
A practical report links the condition value with time, place, and action. It should help a reviewer decide whether to keep observing, inspect the field point, compare nearby instruments, or record the event as normal site behavior.
For owners, the strongest record is the one that remains understandable after staff changes. Clear units, plain point names, installation photos, maintenance notes, and linked structural channels make the data usable beyond the original project team.
The future of soil moisture temperature sensor
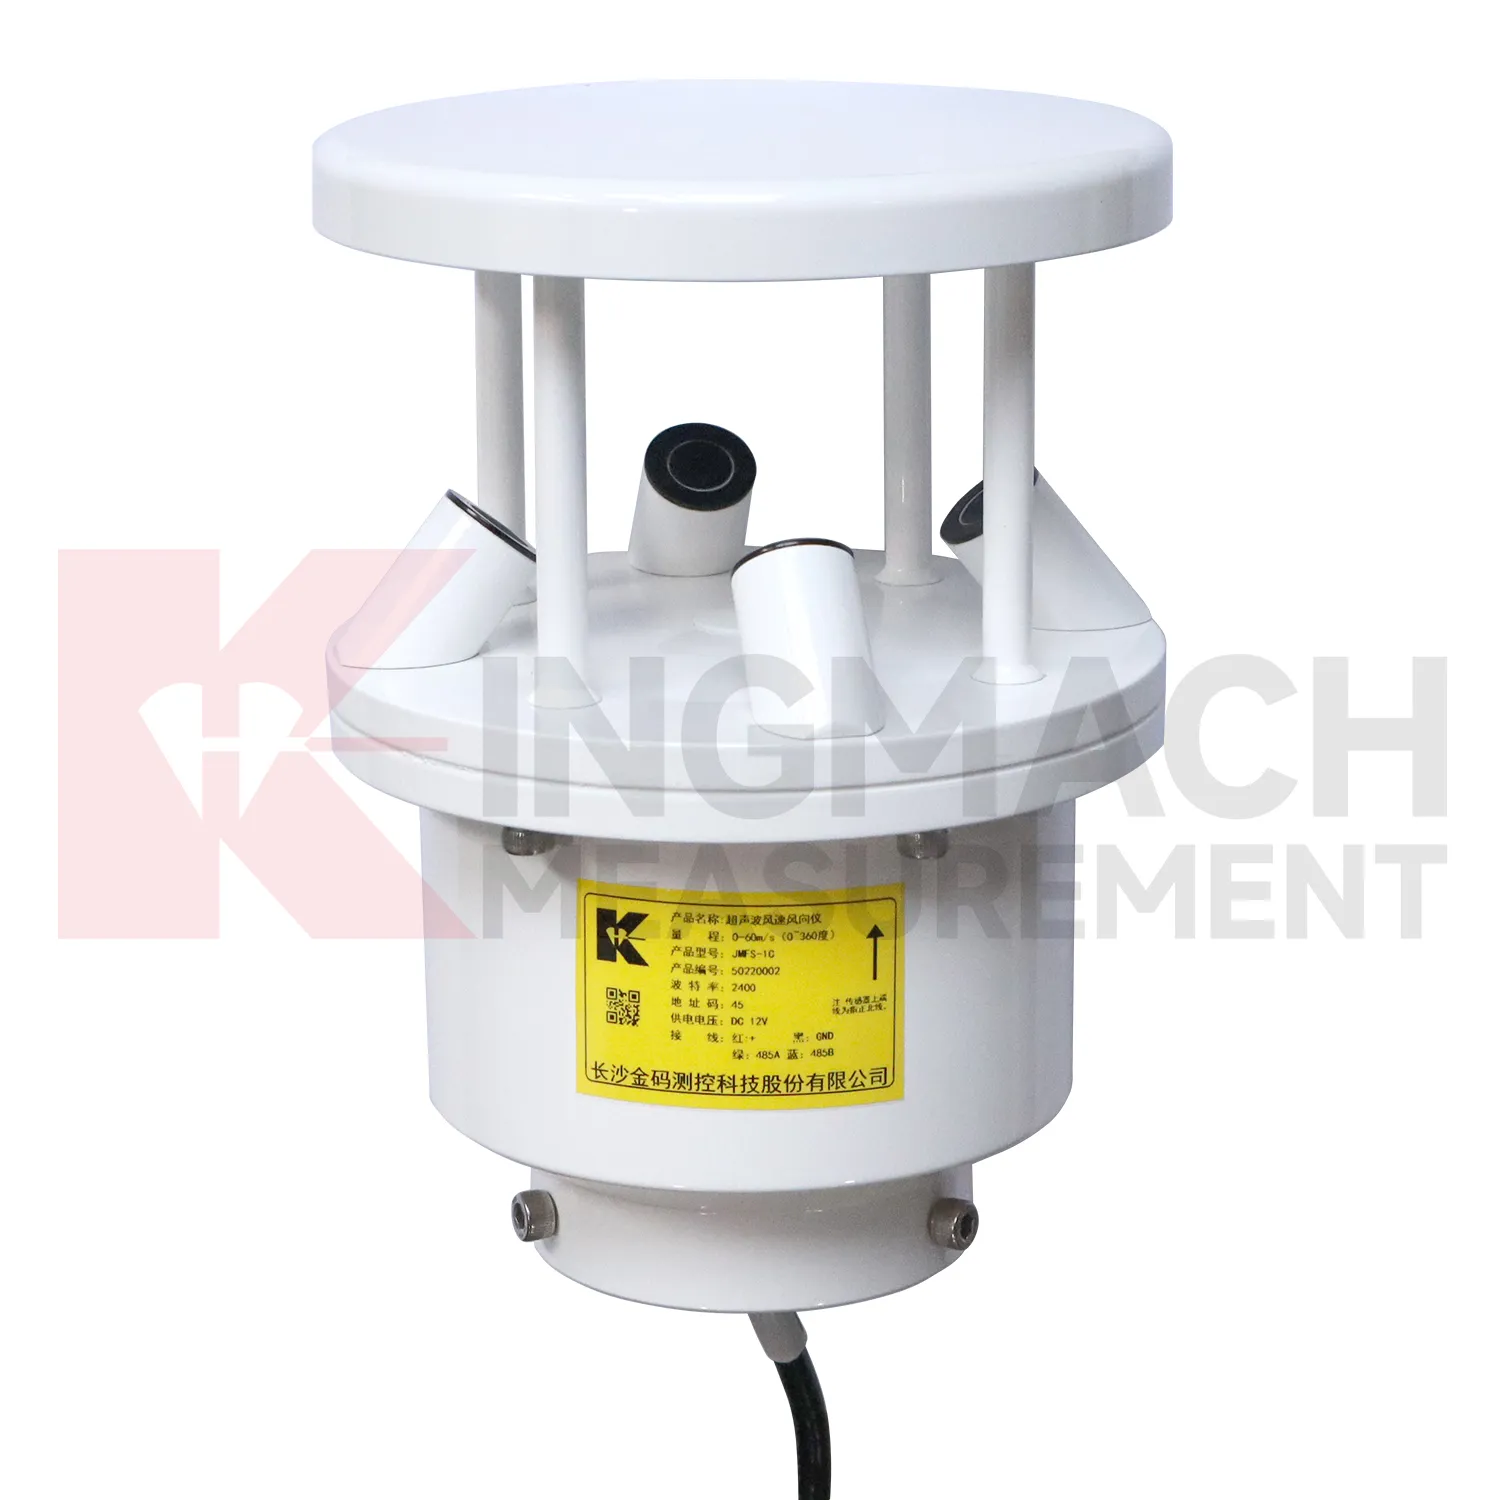
Wind context will become a stronger part of future Kingmach soil moisture temperature sensor for bridges, towers, airports, marine structures, and high buildings. Wind speed alone is often not enough; direction, gust timing, pressure, temperature, and structural response all matter. Future platforms should connect wind records with acceleration, tilt, displacement, strain, and inspection events. When vibration rises, the reviewer can quickly judge whether it matched known exposure or points to a separate issue. This will improve confidence during storms and high-wind periods. It will also help owners decide when to schedule inspection, restrict access, or compare present response with earlier events.
Wind-event records should also keep exposure notes, station height, nearby obstructions, and maintenance access visible. A sensor mounted on a roof edge, bridge tower, airport mast, or coastal structure may see very different airflow from a sheltered point nearby. Future reporting should make that difference clear so teams do not compare unrelated wind records as if they represent the same condition.
For long-term review, repeated wind events can become a useful operating history. Owners can compare similar wind directions across seasons, check whether structural response remains stable, and decide whether an inspection is needed after a severe event. That turns wind monitoring into a maintenance planning tool rather than only a weather record.
Care & Maintenance of soil moisture temperature sensor
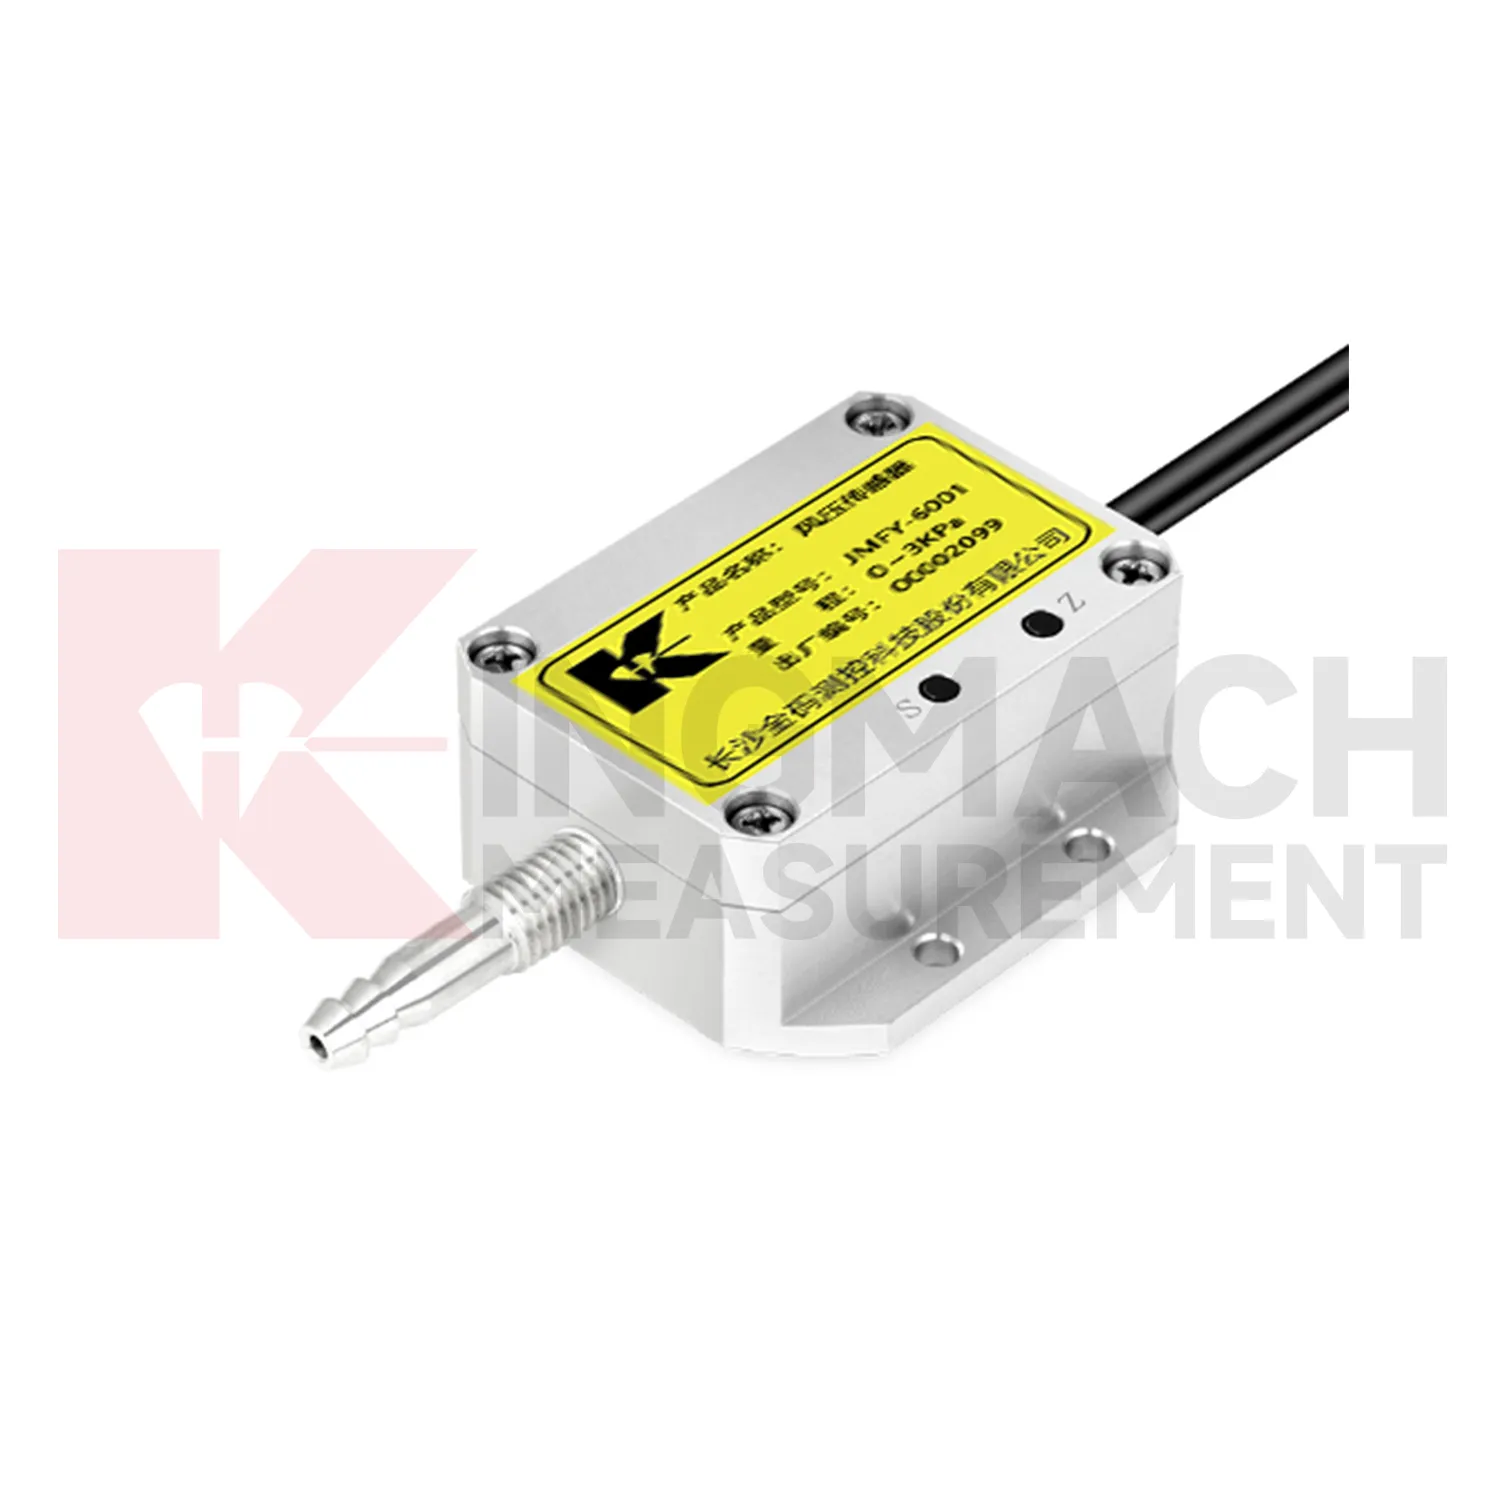
Pressure-channel maintenance for Kingmach soil moisture temperature sensor should keep the pressure path open, clean, and sealed. Tubes, ports, fittings, housings, cables, and power connections should be inspected after storms, dust exposure, washdown, cabinet work, or mechanical impact. Moisture, blockage, loose tubing, or wrong wiring can create readings that look like a pressure event. Pressure data may be reviewed beside wind, airflow, vibration, and structural response, so channel reliability matters. If pressure behavior does not match surrounding conditions, inspect the physical path before assuming the environment changed. A short maintenance note can prevent a long engineering debate later.
During abnormal events, the first question is not only whether the value crossed a limit. The reviewer should ask what changed around the site, whether the related structure reacted, and whether a field inspection confirmed the same pattern.
Long-term value comes from consistency. A channel that keeps the same location, unit, maintenance history, and linked asset record can support seasonal comparison, post-storm review, and handover between construction and operation teams.
Kingmach soil moisture temperature sensor
Kingmach soil moisture temperature sensor helps engineering teams read the conditions around a structure before they judge the structure itself. Temperature, humidity, rainfall, wind, pressure, and soil wetness can all change how bridges, tunnels, slopes, buildings, dams, and construction sites behave. A deformation curve after a storm is different from the same curve during a dry week. A strain record during a heat wave needs a temperature background. A cabinet fault in a tunnel may have more to do with moisture than with the instrument connected to it. The purpose of this category is to make those surrounding conditions visible. When environmental records sit beside settlement, displacement, tilt, load, vibration, and inspection notes, engineers can explain why a reading changed instead of only seeing that it changed.
For field teams, this point is most useful when the record shows the condition before the structural response, during the response, and after the site returns to routine operation. The note should include weather timing, inspection access, nearby construction, and whether the linked structural points changed in the same period.
FAQ
Q: How does rainfall data support slope review?
A: Rainfall gives the timing and intensity background for movement, seepage, wetting, and field inspections after storms.
Q: Why measure soil wetness as well as rainfall?
A: Rainfall stays at the surface record, while buried wetness shows whether water reached the soil depth that may influence movement.
Q: How does wind data support bridge or tower monitoring?
A: Wind direction and exposure can explain vibration, deflection, access difficulty, and weather-driven structural response.
Q: Why monitor humidity underground?
A: Humidity can affect cabinets, connectors, corrosion, sensor stability, and operating conditions in tunnels, subways, mines, and equipment spaces.
Q: How does temperature help interpretation?
A: Temperature helps reviewers separate thermal behavior from structural change in strain, displacement, cabinet condition, or material response.
Long-term value comes from consistency. A channel that keeps the same location, unit, maintenance history, and linked asset record can support seasonal comparison, post-storm review, and handover between construction and operation teams.
Reviews
Andrew Lee
The visualization software is intuitive and powerful. It helps us analyze monitoring data efficiently.
James Thompson
The tiltmeters and accelerometers are very sensitive and provide precise data. Perfect for our structural health monitoring system.
Latest Inquiries
To protect the privacy of our buyers, only public service email domains like Gmail, Yahoo, and MSN will be displayed. Additionally, only a limited portion of the inquiry content will be shown.
Amelia***@gmail.comSingapore
Hello, I am looking for visualization software for monitoring system data analysis. Please let me kn...
Sophia***@gmail.comUnited Kingdom
Good day, we need environmental monitoring sensors including temperature, humidity, and wind sensors...
Related product categories
- tipping bucket rain gauge 0.2 mm resolution standard
- tipping bucket rain gauge data logger
- tipping bucket rain gauge resolution 0.1 mm typical
- tipping bucket rain gauge resolution 0.2 mm typical
- tipping bucket rain gauge typical resolution 0.2 mm standard
- typical tipping bucket rain gauge resolution 0.2 mm standard
- Temperature Sensor
- Chain-type Temperature Sensor
- Temperature String
- Daisy-Chained Digital Thermometer
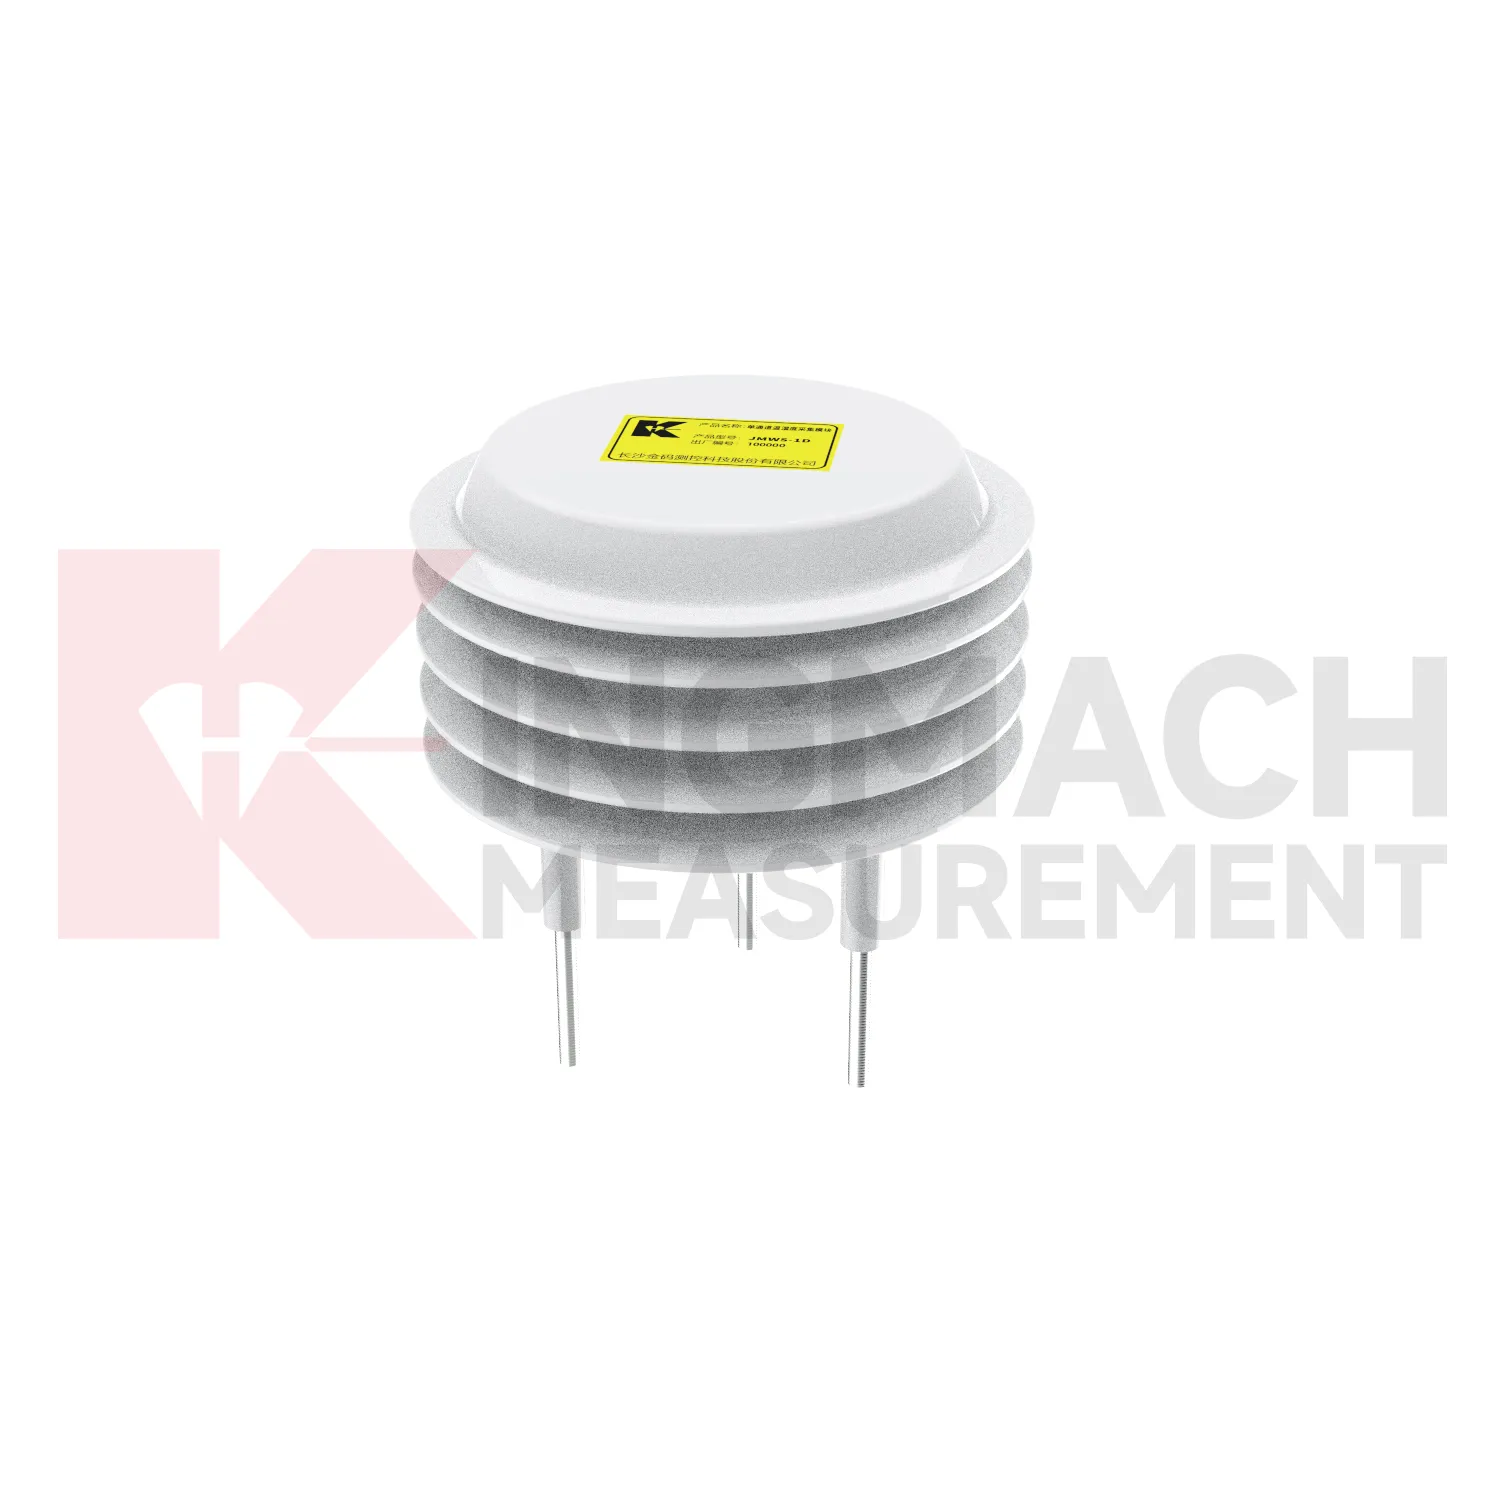
- Single-Channel Temperature and Humidity Acquisition Module
- Environmental Monitoring