
 EN
EN
 ar
ar bg
bg hr
hr cs
cs da
da nl
nl fi
fi fr
fr de
de el
el hi
hi it
it ko
ko no
no pl
pl pt
pt ro
ro ru
ru es
es sv
sv tl
tl iw
iw id
id lv
lv lt
lt sr
sr sk
sk sl
sl uk
uk vi
vi et
et hu
hu th
th tr
tr fa
fa ms
ms hy
hy ka
ka ur
ur bn
bn mn
mn ta
ta kk
kk uz
uz ku
ku
load cell connection diagram
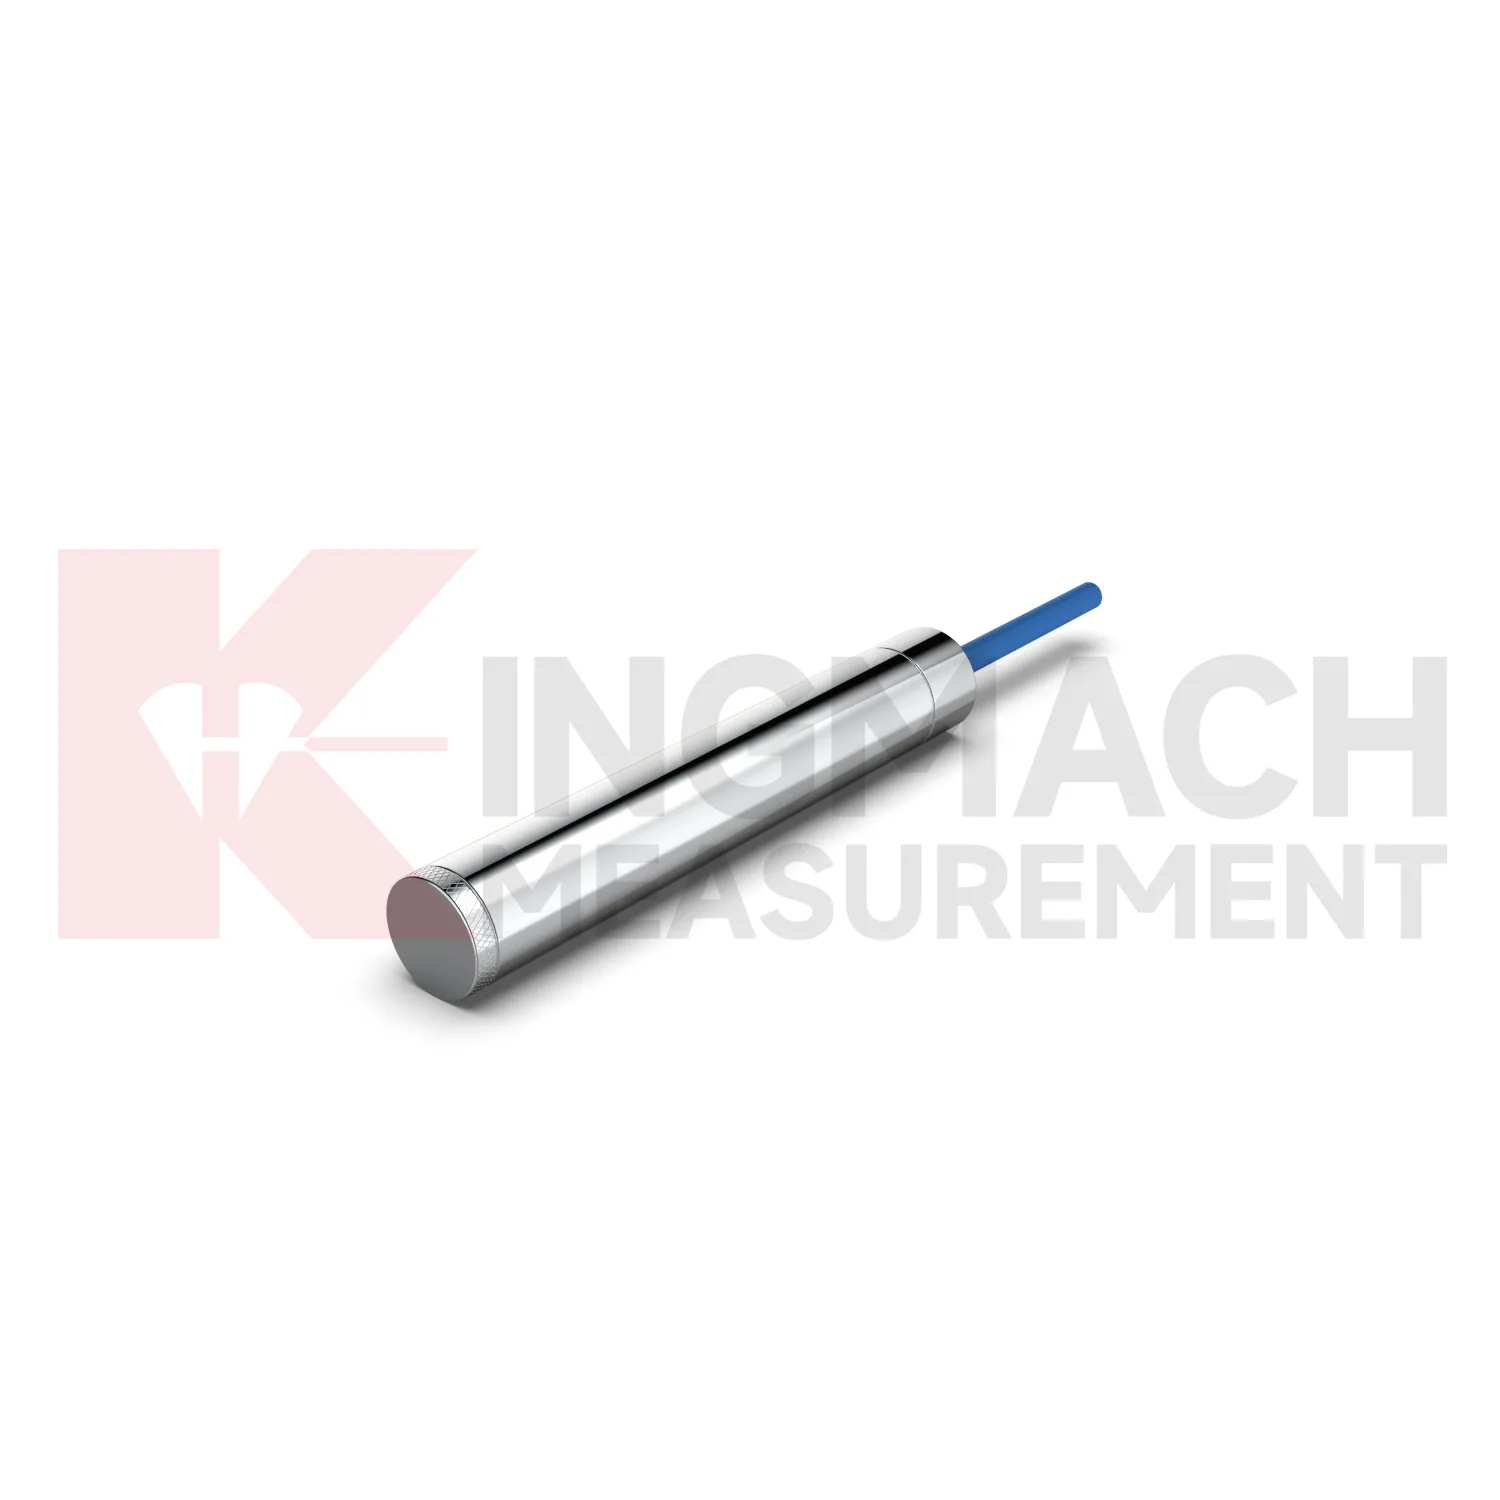
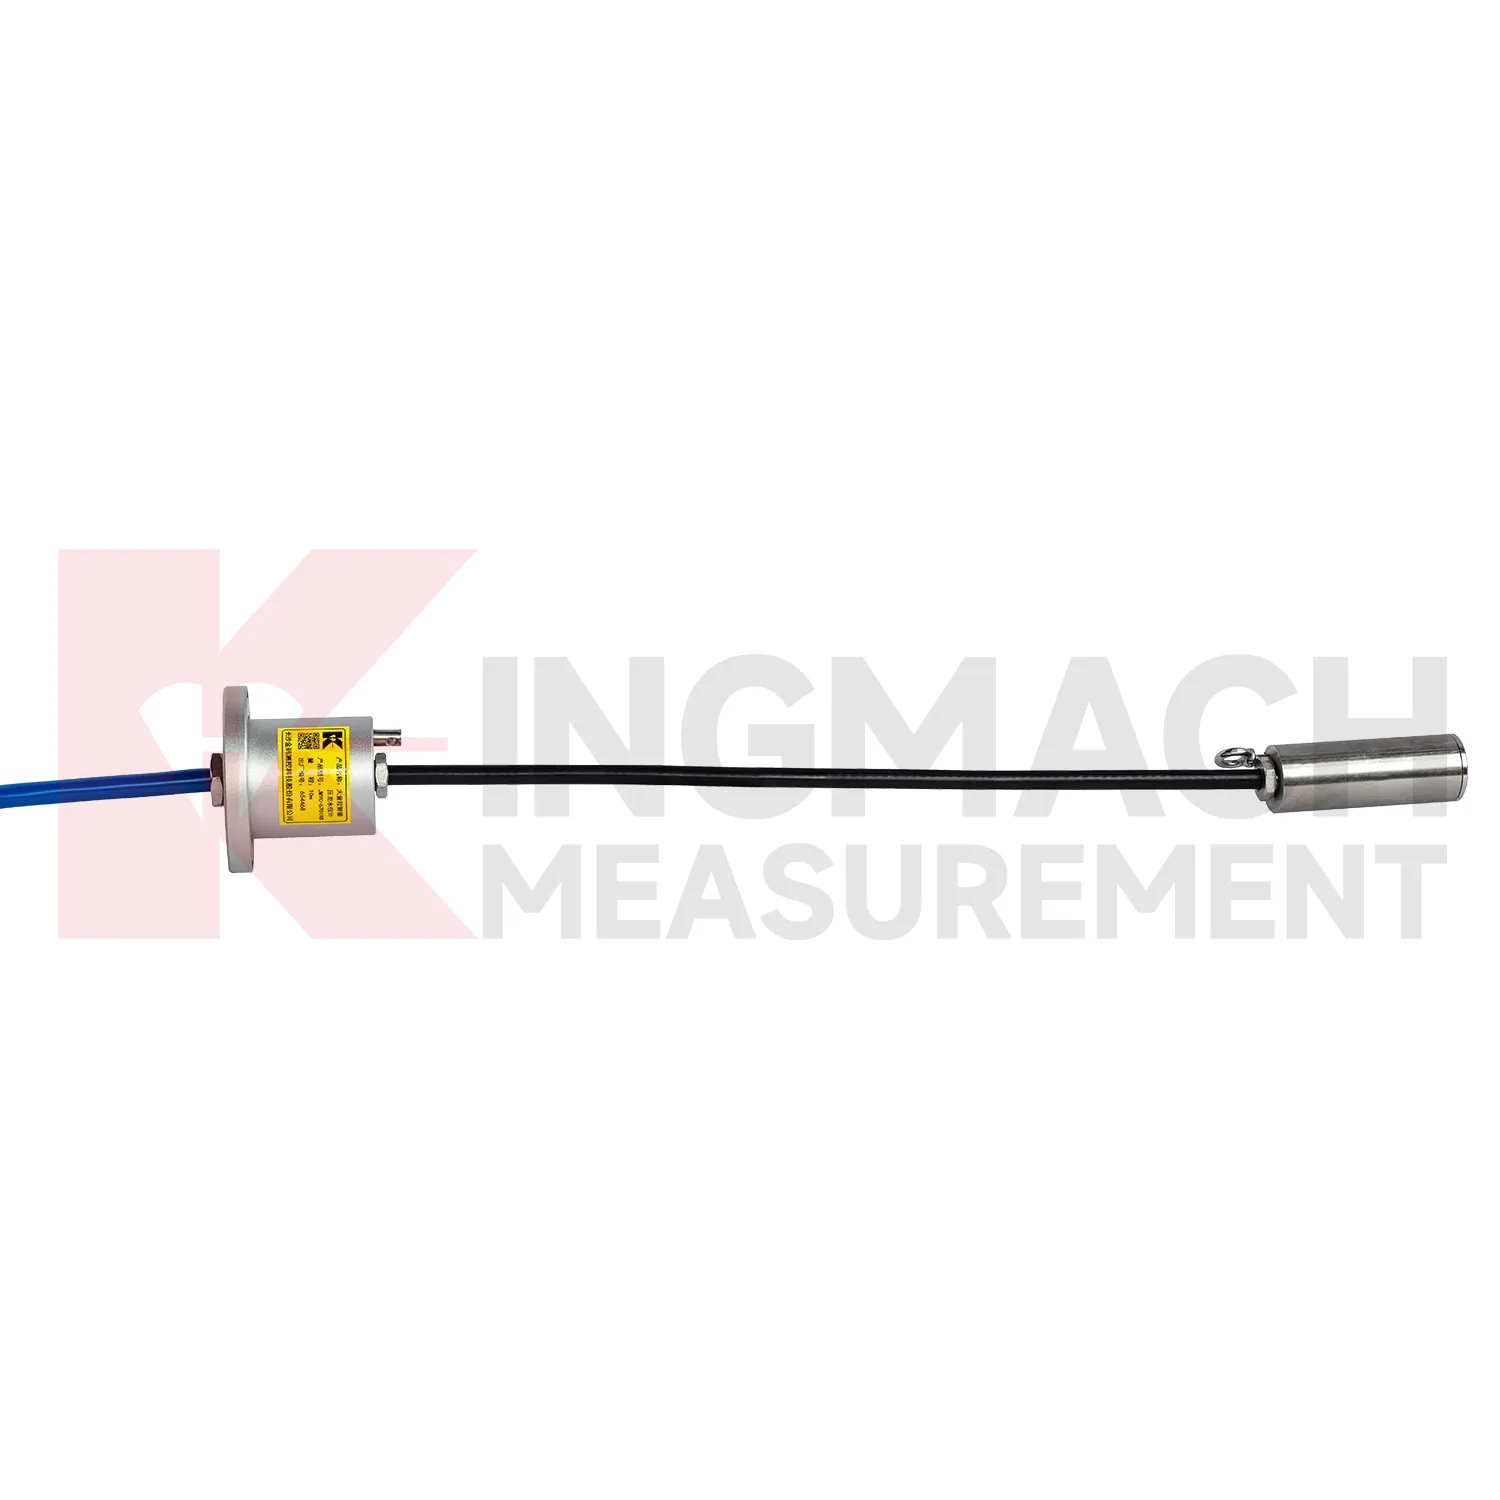
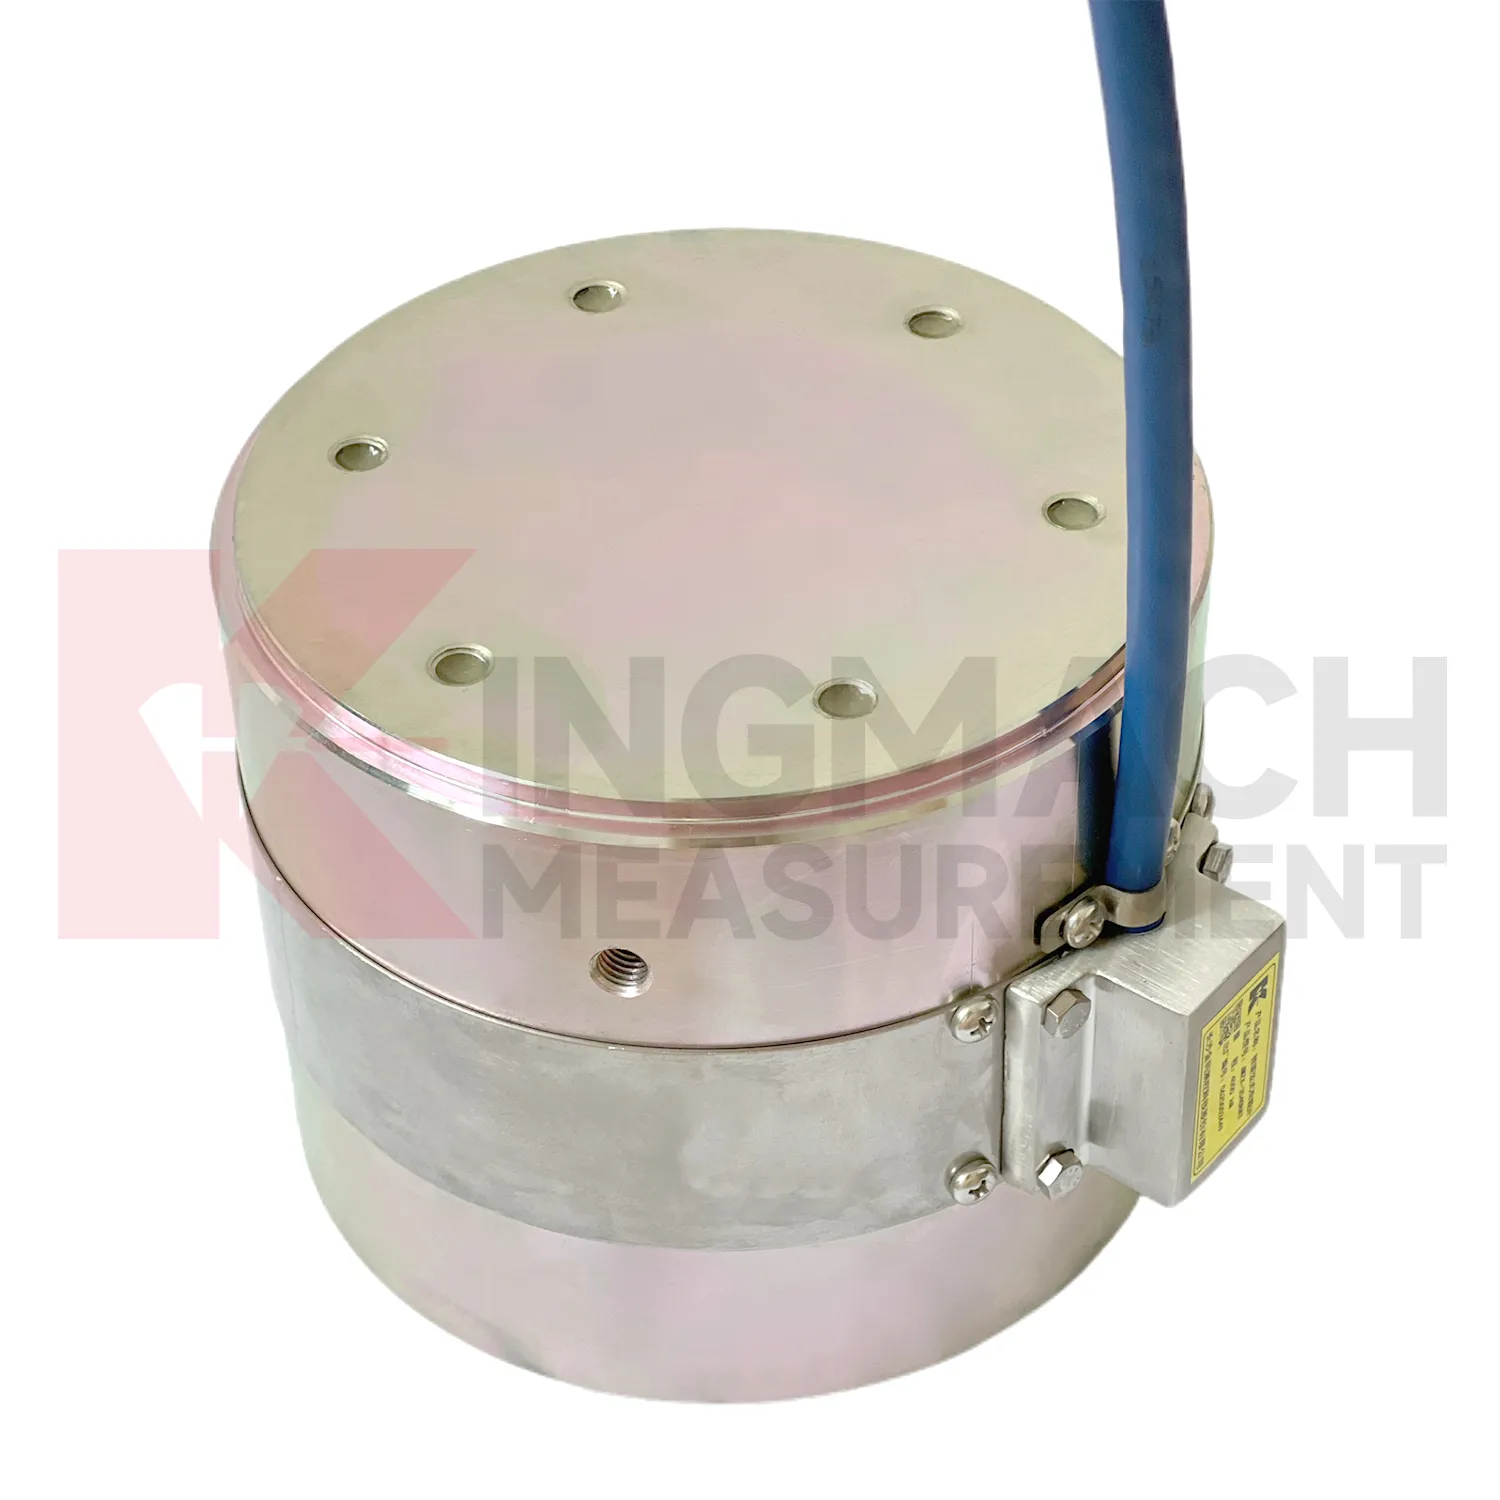
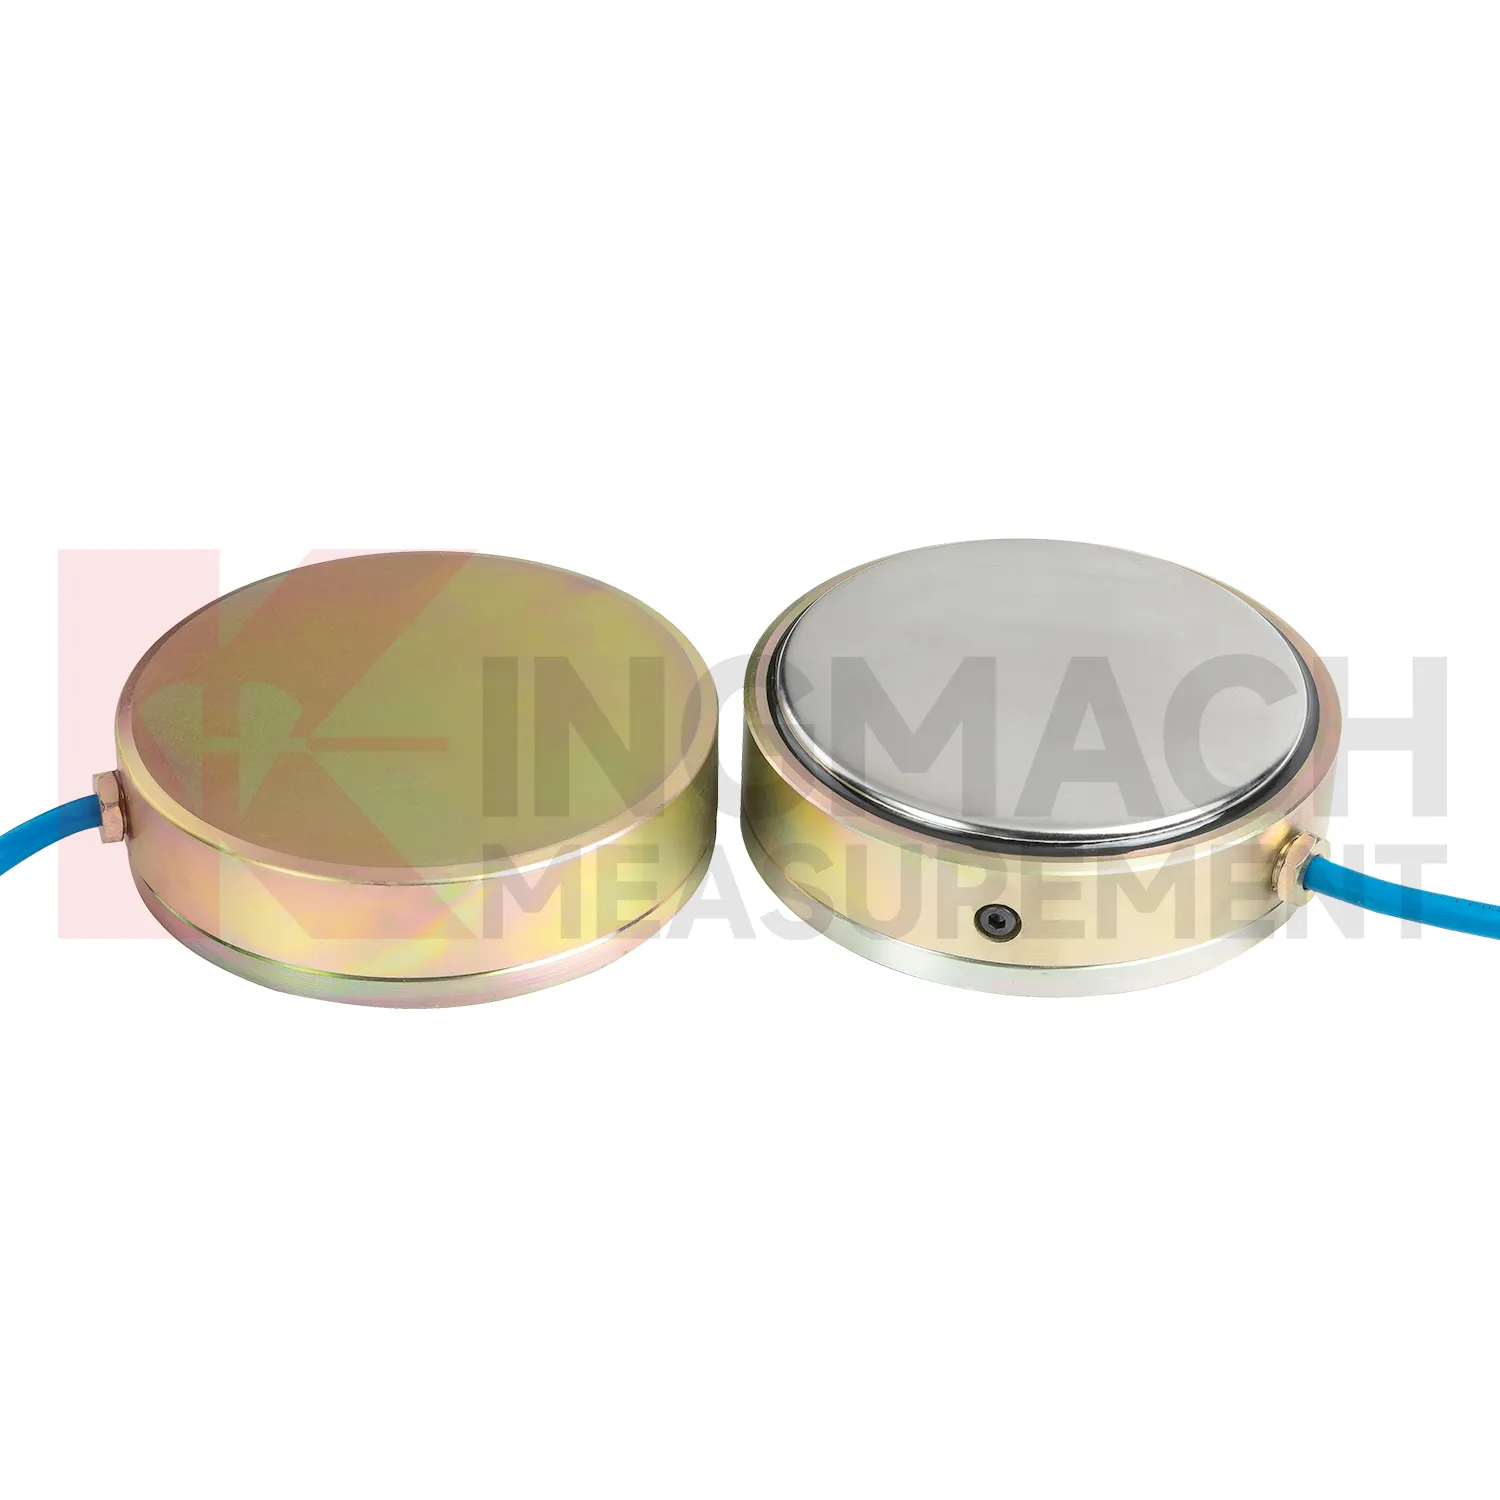
Kingmach load cell connection diagram can also include pressure related sensing where soil or structural contact pressure is the main concern. The JMZX-50XXAT/ATM earth pressure cell family is listed in 0.3 MPa, 0.6 MPa, 1 MPa, 2 MPa, 4 MPa, 6 MPa, and 8 MPa ranges, with 0.001 MPa pressure resolution, 0.5%FS pressure accuracy, and ±0.5°C temperature accuracy. The product information also refers to high strength elastic steel, waterproof and durable construction, a 50 year design life, 800 stored measurement sets, and automated acquisition support. For retaining structures, embankments, dams, tunnels, and foundation pits, those pressure records help engineers understand whether earth load, water influence, compaction, or excavation stage changes are affecting the structure. Kingmach's broader monitoring catalog allows these readings to be compared with settlement, water pressure, displacement, and tilt. That connection is important because pressure change without movement may still indicate a developing load redistribution that deserves closer inspection. The same site places these instruments within a wider monitoring range, including piezometers, water level meters, displacement transducers, settlement sensors, tiltmeters, cables, data loggers, and software. That wider range helps when a project needs force data to be compared with movement, water, and temperature records.


Application of load cell connection diagram
In railways, highways, and transport corridors, load cell connection diagram can monitor bridge support loads, subgrade pressure, retaining structure forces, and temporary works near active traffic. The difficulty is that access windows are short, vibration is frequent, and data gaps can create uncertainty during maintenance review. Kingmach smart load products support digital output, anti-interference transmission, built-in temperature correction, and stored model or calibration information. Solid load cells list 1000 kN to 10000 kN ranges and 0.5%FS precision, while axial force meters cover 200 kN to 3000 kN for support load points. These specifications suit high capacity structural members and staged construction near operating routes. A monitoring plan should record traffic condition, construction activity, temperature, and any maintenance event near the sensor. For owners, the value lies in trend comparison: whether support loads change after traffic opening, whether subgrade pressure rises after heavy rainfall, or whether temporary structures remain within expected force limits before removal. For transport corridors, the inspection schedule should account for possession windows, traffic vibration, and safe access. Remote acquisition may reduce field visits, but periodic visual checks still catch damaged cables, water entry, and loose junction boxes. Access for inspection should also be planned before backfilling, because later hardware checks may be harder than taking the reading itself.
The future of load cell connection diagram
Future load cell connection diagram networks will need better alarm logic than fixed thresholds alone. A 5 percent force rise may be routine during concrete curing, serious during anchor relaxation, or irrelevant during a temperature swing. Kingmach products with temperature correction, stored records, digital output, and compatible data acquisition provide the raw structure for richer judgment. The next technical path is multi-parameter comparison: force plus displacement, pressure plus water level, support load plus excavation stage, cable force plus temperature. AI analysis can help rank unusual patterns, but the field team still needs plain evidence: which point changed, how fast, under what condition, and whether nearby sensors agree. Digital twin platforms can make that easier when sensor locations and calibration data are reliable. As monitoring specifications become more demanding, the instruments that win trust will be the ones that keep readings traceable from installation through maintenance, not just during the first acceptance test. Good metadata will matter as much as communication speed.
Care & Maintenance of load cell connection diagram
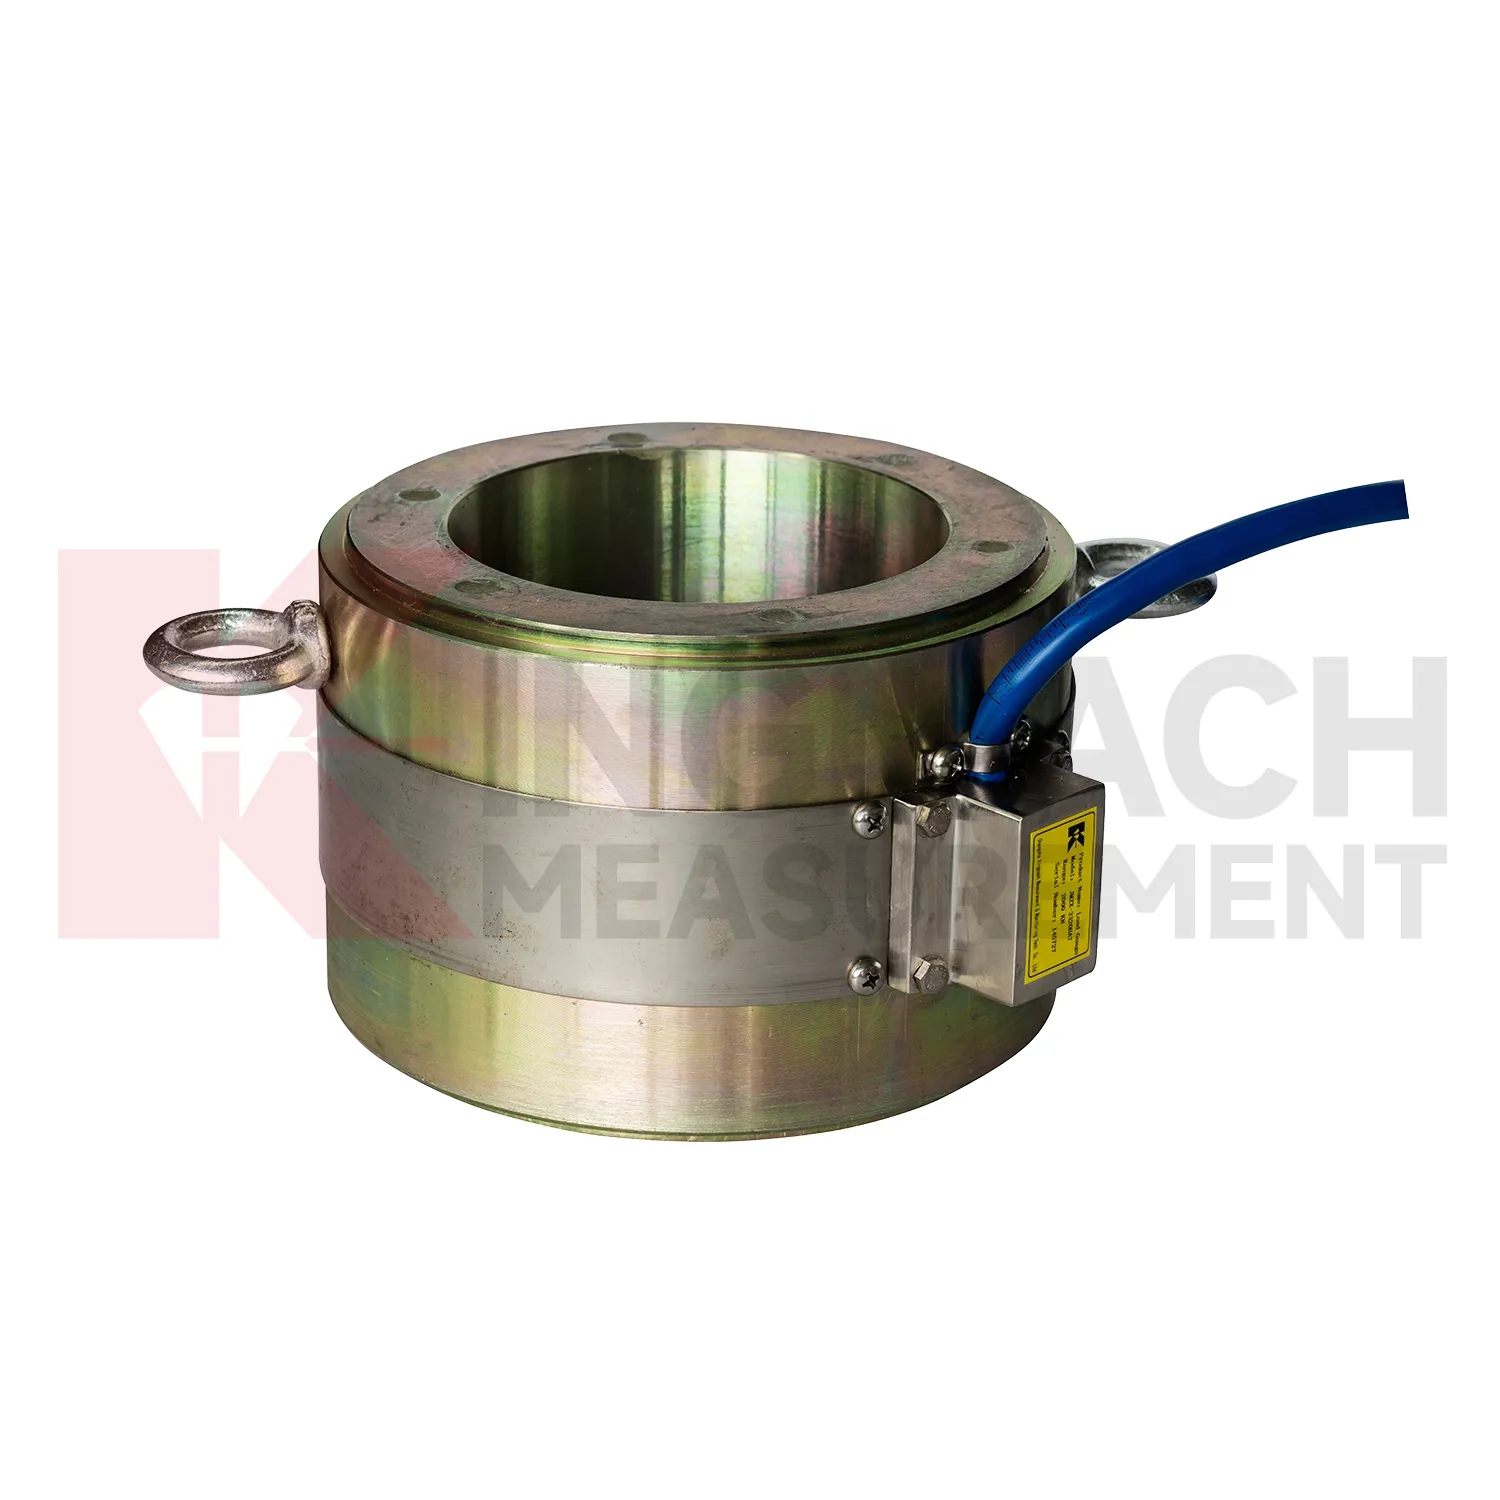
For load cell connection diagram, installation quality usually determines whether later maintenance is simple or painful. Before loading, confirm the model, range, calibration coefficient, zero value, bearing surface, and cable route. Hollow load cells may cover 500 kN to 8000 kN, while solid load cells may reach 10000 kN, so capacity should be checked against both working load and possible overload. During installation, keep bearing plates flat and strong enough to avoid stress concentration, especially on axial force meters and compression load points. Protect cables from bending, pulling, welding sparks, crushing, and water entry at connectors. After the first stable reading, record temperature, channel name, instrument serial information, and site condition. During long term use, inspect sealing, cable jackets, junction boxes, and acquisition channels after rainfall, excavation changes, jacking, or impact. If a value drifts, check temperature, connector condition, zero history, and nearby sensors before assuming the instrument has failed. Document who made the check.
Kingmach load cell connection diagram
load cell connection diagram belongs at the point where a drawing stops being a guess and the structure begins to report what is really happening. In Kingmach engineering monitoring, force data is used around bridge cables, anchor heads, pier bearings, pile tests, retaining systems, and temporary steel supports. The reading is not only a number in kN. It is a record of where the force sits, when it changed, and which construction or service condition caused that change. A practical monitoring plan often pairs force with displacement, settlement, tilt, temperature, water pressure, or rainfall, because load rarely moves alone. For procurement teams, the useful questions are direct: capacity range, accuracy, installation space, cable route, waterproofing, calibration record, and data acquisition method. When these items are settled before site work starts, the same instrument can support acceptance checks, construction control, and later maintenance decisions without forcing engineers to rebuild the data story. That early planning also keeps later reports from mixing force trends with installation doubts.
FAQ
Q: Can load cell connection diagram be used for soil pressure or retaining wall pressure? A: Yes, pressure related models such as earth pressure cells are used where the measured value is contact pressure rather than direct member force. Q: What ranges are listed for Kingmach earth pressure cells? A: The JMZX-50XXAT/ATM family lists 0.3 MPa, 0.6 MPa, 1 MPa, 2 MPa, 4 MPa, 6 MPa, and 8 MPa ranges. Q: What accuracy and resolution are listed? A: The product file gives 0.001 MPa pressure resolution, 0.5%FS pressure accuracy, and ±0.5°C temperature accuracy. Q: Where are these readings useful? A: Foundation pits, dams, slopes, retaining walls, embankments, tunnels, and buried structures. Q: What maintenance issue is most common? A: Cable damage, water entry, channel confusion, and poor installation records cause many field doubts.
Reviews
Daniel Brown
Excellent environmental monitoring sensors. The data is consistent, and the system integrates smoothly with our existing setup.
Joshua Clark
We ordered a full monitoring solution including sensors and data loggers. Everything works seamlessly together. Great supplier!
Latest Inquiries
To protect the privacy of our buyers, only public service email domains like Gmail, Yahoo, and MSN will be displayed. Additionally, only a limited portion of the inquiry content will be shown.
Emma***@gmail.comCanada
Dear Sir/Madam, we are interested in displacement transducers and settlement sensors for a geotechni...
Harper***@gmail.comIndia
Dear Sir, we are planning to procure a complete monitoring system including strain gauges, tiltmeter...