 ar
ar bg
bg hr
hr cs
cs da
da nl
nl fi
fi fr
fr de
de el
el hi
hi it
it ko
ko no
no pl
pl pt
pt ro
ro ru
ru es
es sv
sv tl
tl iw
iw id
id lv
lv lt
lt sr
sr sk
sk sl
sl uk
uk vi
vi et
et hu
hu th
th tr
tr fa
fa ms
ms hy
hy ka
ka ur
ur bn
bn mn
mn ta
ta kk
kk uz
uz ku
ku
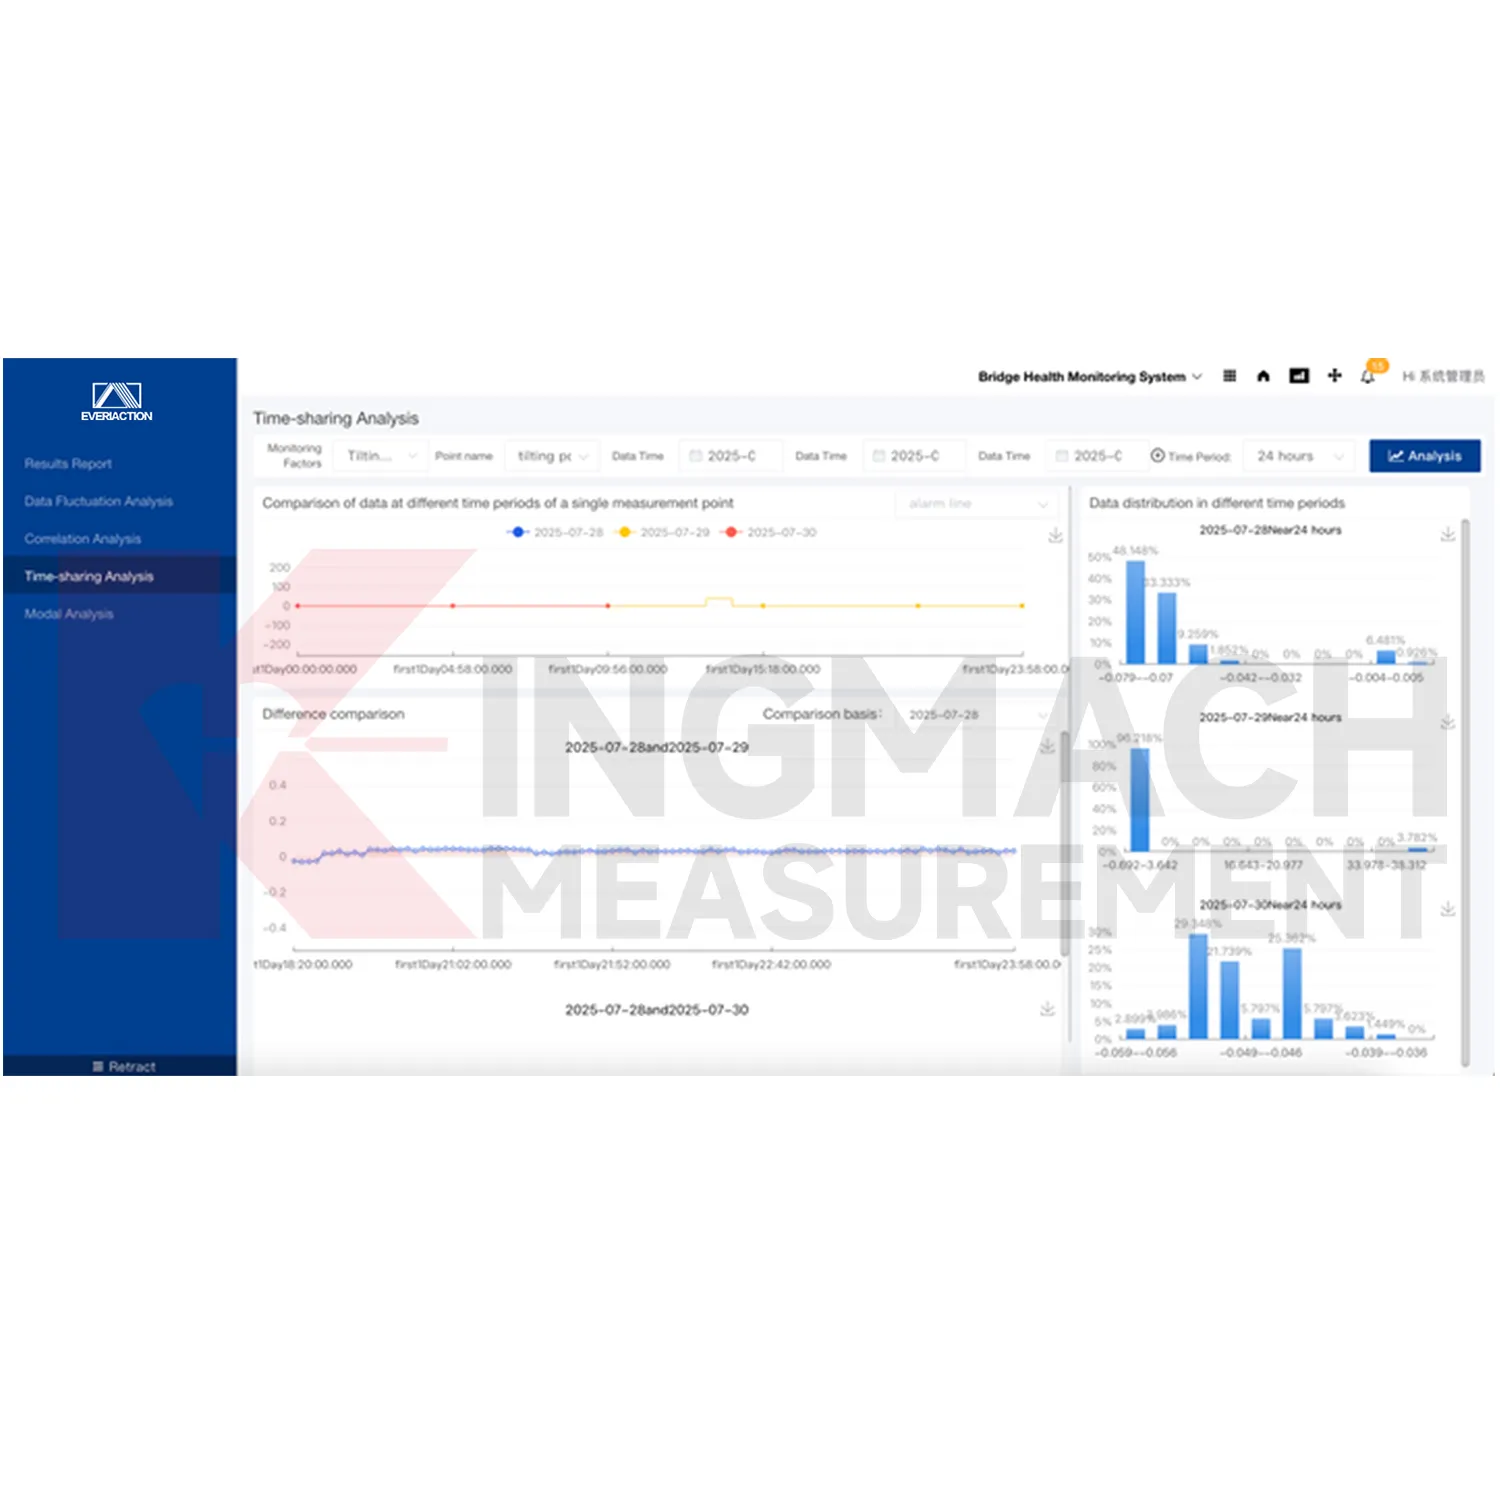
Visualization Software
The platform supports graphical display so complex monitoring data can be converted into clearer visual information. Users can review trends, abnormal early warnings, and reports through a more intuitive interface. This is important because a raw table of readings is rarely enough for quick engineering management. Graphs, alarm status, project documents, and maintenance notes help users see what has changed and what needs attention. Kingmach Visualization Software is therefore positioned as a digital management layer above the field instruments.
Application of Visualization Software
Slope monitoring benefits from Kingmach Visualization Software because slope risk often depends on several data types at once. Displacement, rainfall, groundwater, pore pressure, tilt, settlement, and inspection observations all need to be read together. A cloud-based platform can receive wired or wireless device data from field points that are difficult to access. Trend analysis and visual display help users see whether movement follows rainfall, construction disturbance, seasonal water changes, or a developing instability pattern.
The future of Visualization Software
Future reporting will become more automated through Kingmach Visualization Software. Owners will expect regular summaries, event reports, alarm histories, and maintenance records without rebuilding evidence manually each time. Because the platform stores project information, dynamic records, alarm levels, documents, and monitoring values together, report generation can become faster and more consistent. Expert review will still be needed for engineering conclusions, but the evidence package can be prepared with less repetitive manual work.
Care & Maintenance of Visualization Software
Backup and export planning protects Kingmach Visualization Software records. Monitoring data, alarm histories, reports, and project documents may be needed for maintenance, audits, claims, or engineering review years after collection. Define who can export data, how often backups are checked, and where report files are stored. If the platform is integrated with other systems, confirm that exported timestamps, units, point names, and alarm states remain readable outside the original view.
Kingmach Visualization Software
For daily users, Kingmach Visualization Software must be clear enough for routine checks and deep enough for engineering review. The product category notes an intuitive interface and easy operation, while the product detail emphasizes customizable data presentation. That balance matters. A site operator may need to see whether today's readings are normal, while an engineer may need trend analysis, complex statistics, and related channel comparison. The same platform can serve both needs when project views, alarm levels, and display layouts are configured around the asset.
FAQ
Q: How should a project be prepared?
A: Define asset folders, monitoring zones, measuring points, units, alert grades, and report needs before launch.
Q: What should be tested at go-live?
A: Test incoming values, time order, engineering units, graph refresh, alarm trigger, and export output.
Q: Why does alarm logic need review?
A: Different sensor categories and risk levels may need different limits, rates, and escalation steps.
Q: How should files stay current?
A: Update drawings, point lists, photos, inspection notes, maintenance logs, and reports when the site changes.
Q: What should follow a platform update?
A: Run a short acceptance check on live values, graph pages, alerts, exports, accounts, and stored files.
Reviews
James Thompson
The tiltmeters and accelerometers are very sensitive and provide precise data. Perfect for our structural health monitoring system.
Andrew Lee
The visualization software is intuitive and powerful. It helps us analyze monitoring data efficiently.
Latest Inquiries
To protect the privacy of our buyers, only public service email domains like Gmail, Yahoo, and MSN will be displayed. Additionally, only a limited portion of the inquiry content will be shown.
Mia***@gmail.comNetherlands
Dear team, we are interested in your readouts & data loggers compatible with multiple sensors. Do yo...
Sophia***@gmail.comUnited Kingdom
Good day, we need environmental monitoring sensors including temperature, humidity, and wind sensors...
Related product categories
- Monitoring Software Suite
- Monitoring system software platform
- Environmental Monitoring
- Visualization Software
- GPS Displacement Monitoring System
- Integrated Monitoring Station
- Settlement Monitoring Rod
- Structural Health Monitoring (SHM) System
- Structural Monitoring Cloud Platform
- IoT Online Monitoring System
- Monitoring System Platform & Services
- Engineering Pulse Intelligent Monitoring Cloud Platform